
Figure 7.
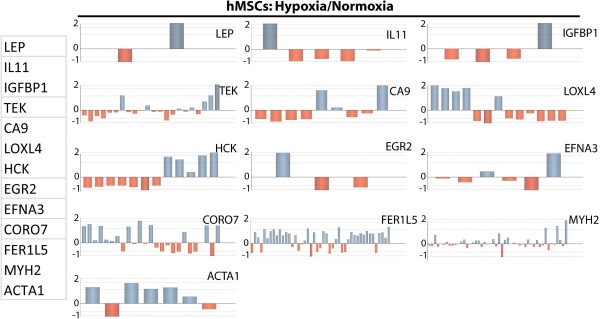
Splicing maps of highly regulated genes with high splice indices. Genes were selected based on highest positive (LEP, IL11, IGFBP1, TEK, CA9, LOX4, HCK, ERG2) and negative (EFNA3, CORO7, FER1L5, MYH2, ACTA1) fold change of gene expression hypoxia vs. normoxia. Bar graphs indicate hypoxic/normoxic differential exonic expression levels (n = 3).