Figure 8.

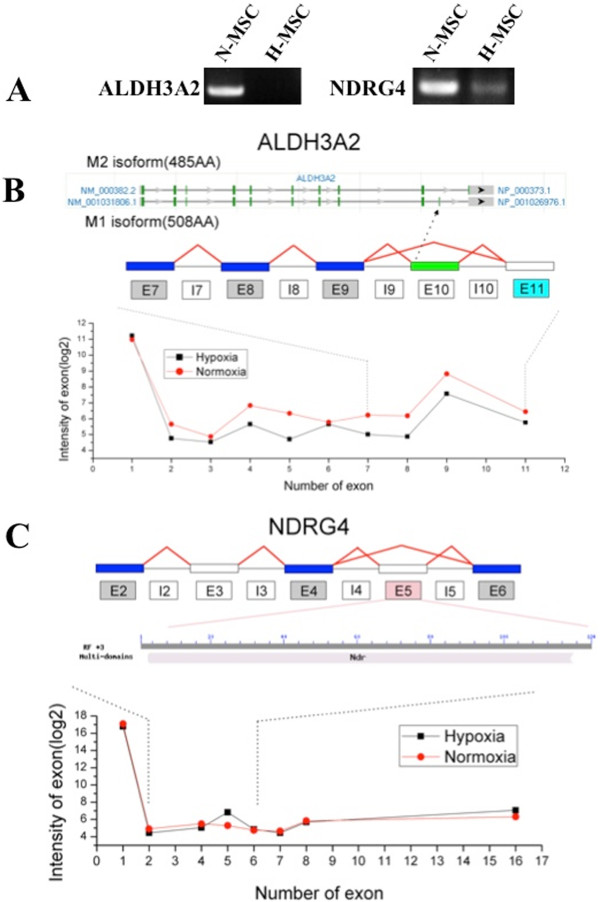
Oxygen-dependent differential splicing of the ALDH3A2 and NDRG4 genes. (A) Expression of splice isoforms confirmed by RT-PCR of genes with prior evidence of AS. (B) Annotation of each alternative isoform (M2 and M1, top graphic), exon structure (middle graphic) and expression profiles (bottom graphic) for ALDH3A2. Light blue boxes indicate down-regulation for hypoxic (H) versus normoxic (N) MSCs; gray boxes indicate no significant change; white boxes indicate no probe detection above expression threshold. The green exon (exon10) indicates the unique exon of isoform M1. Exon expression values (log2) are displayed for both H-MSC (black data points) and N-MSC (red data points), ranked in order of genomic position on the x-axis. The various isoforms can be validated in the PCR result although there is no probe annotated to the isoform-specific exon. (C) Exon structure (top graphic) modified domain of AS (middle graphic) and expression profiles (bottom graphic) for NDRG4. Light red boxes indicate up-regulation for hypoxic (H) versus normoxic MSCs (N) MSCs; gray boxes indicate no significant change; white boxes indicate no probe detection above expression threshold. A Modified or disrupted conserved domain of differentially expressed exon is from the CDD database (NCBI). Exon expression values (log2) are displayed for both H-MSC (black data points) and N-MSC (red data points), ranked in order of genomic position on the x-axis.
