Figure 1.

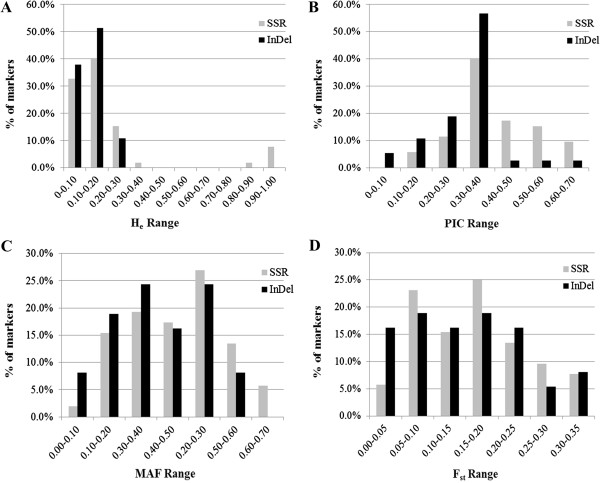
Comparison the distribution of observed heterozygosity (H e ) (A), polymorphic information content (PIC) (B), minor allele frequency (MAF) (C) and F-statistics (F st ) (D) between SSR and InDel markers.

Comparison the distribution of observed heterozygosity (H e ) (A), polymorphic information content (PIC) (B), minor allele frequency (MAF) (C) and F-statistics (F st ) (D) between SSR and InDel markers.