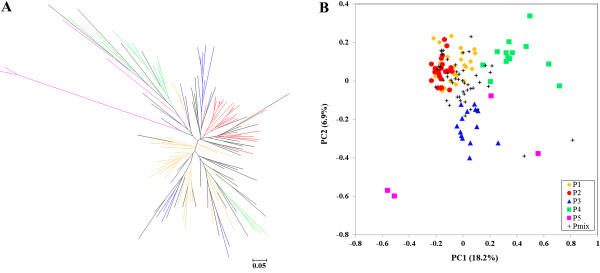
Figure 4.

Representation of genetic structure of 130 sesame lines based on Neighbor-joining phylogenetic tree (NJ-tree) (A) and Principal component analysis (PCA) (B). P1, P2, P3, P4, P5 and Pmix are subgroups identified by STRUCTURE assigned with the maximum membership probability. For NJ-tree and PCA plot, the different colored lines or plots represent the different subgroups inferred by STRUCTURE analysis. P1 yellow, P2 red, P3 blue, P4 green, P5 pink, Pmix black.
