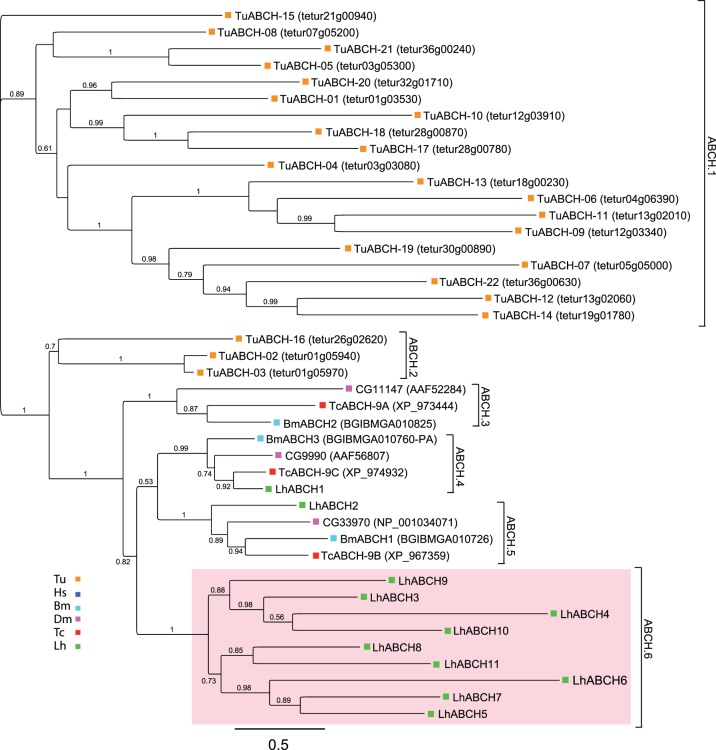
Figure 6. Phylogenetic analysis of ABCH transporters from L. hesperus and four metazoan species.
The scale bar represents 0.5 amino acid substitutions per site. Analyses, abbreviations, and color-coding are as in Figure 1. Because the ABCH subfamily is largely restricted to the arthropod lineage, no representative sequences for H. sapiens are available and thus the analyses were performed using only arthropod sequences. L. hesperus ABCH sequences that have undergone gene expansion are shaded light red.

