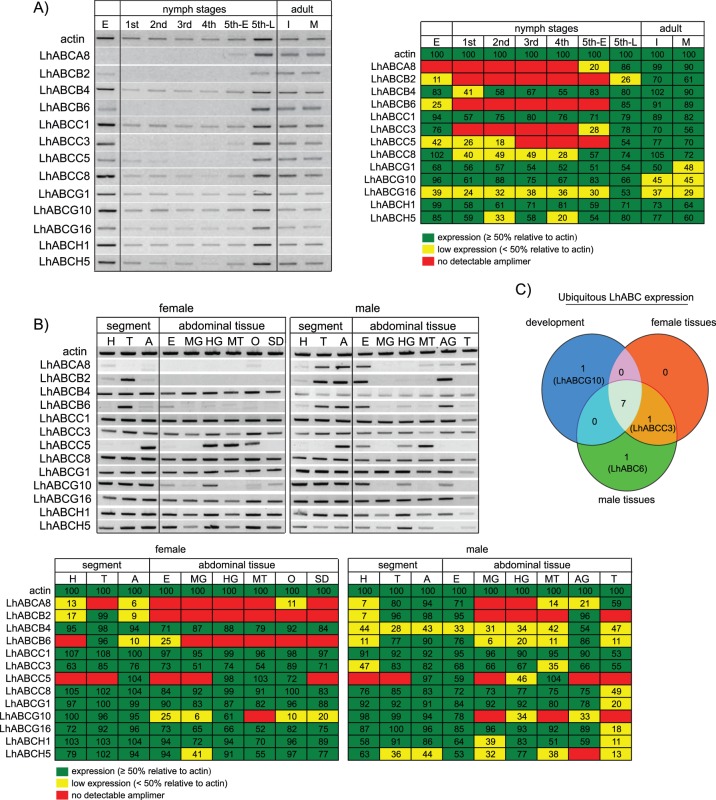
Figure 7. Transcriptional expression profile of 13 LhABC transcripts.
A) Developmental profile. Expression profile of 13 LhABC transporters in eggs through 12-day-old adults was examined by end-point PCR using primers designed to amplify a ∼500 bp fragment of each transcript. Abbreviations: E, eggs; 1st, first instars; 2nd, second instars; 3rd, third instars; 4th, fourth instars; 5th-E, early stadium fifth instars; 5th-L, late stadium fifth instars; I, reproductively immature 1-day-old mixed sex adults; M, mature 12-day-old mixed sex adults. Products were analyzed on 1.5% agarose gels and stained with SYBR Safe. Actin was used as a positive control. Leftmost image - Representative gel image. For clarity, the negative image is shown. Rightmost image – Visual aid depicting semi-quantitative analysis of amplimers of interest compared to actin in the representative gel. Relative to the actin amplimer of each developmental stage, cells with amplimer intensity ≥50% are indicated in green, while cells <50% are indicated in yellow. Red cells indicate no detectable amplimer. Numbers inside individual cells denote the percentage of amplimer intensity compared to actin. The primer set used for LhABCC1 profiling amplifies a shared region of LhABCC1A and LhABCC1B. B) Adult tissue profile. The expression profile of the 13 LhABC transcripts was examined as above in adult body segments and various abdominal tissues prepared from 7-day-old adults. Abbreviations: H, head; T, thorax; A, abdomen; E, epidermis, MG, midgut; HG, hindgut; MT, Malpighian tubules; O, ovary; SD, seminal depository; AG, accessory glands (lateral and medial); T, testis. Top image - Representative gel image. For clarity, the negative image is shown. Lower image – Visual aid depicting semi-quantitative analysis of amplimers of interest compared to actin in the representative gel. Color shading is as above but relative to the intensity of actin amplimers within each respective tissue. C) Three-way Venn diagram comparing the transcriptional expression profile of LhABC transcripts ubiquitously expressed throughout L. hesperus development (blue) with those expressed in female (red) and male (green) tissues.

