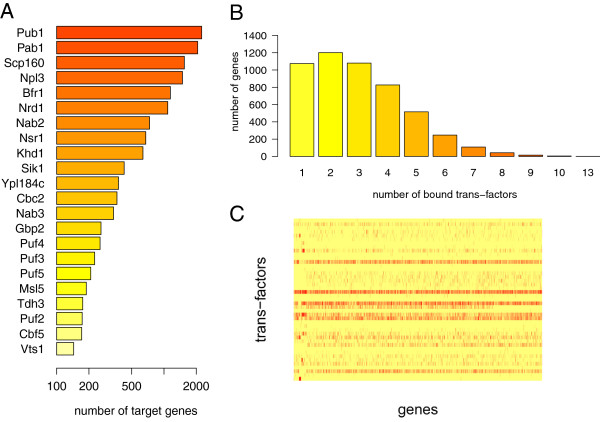
Figure 8.

Interaction maps annotated forS. cerevisiae.(A) Yeast trans-factors (41 RBPs) were ordered according to the number of their annotated target genes. Trans-factors with less than 100 distinct targets are not shown. (B) Distribution of the number of distinct trans-factors bound to the same gene. (C) Graphical representation of the Boolean interaction matrix, derived from the input pairwise interactions. Each row corresponds to a trans-factor, each column to a gene. Positive interactions are displayed in red.
