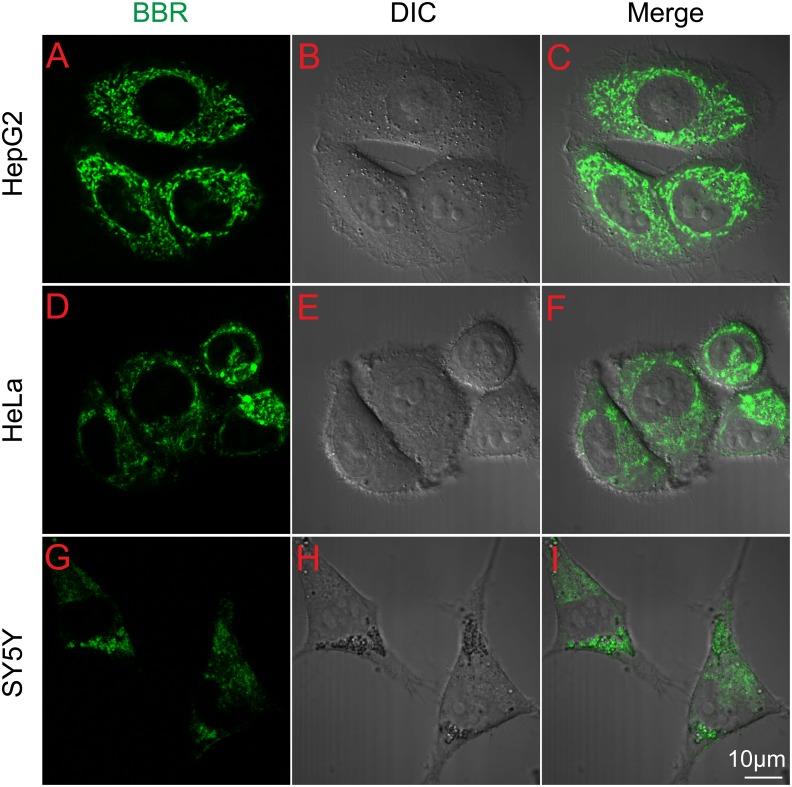
Figure 2. Transportation of BBR through the cells.
(A–I) Images of the subcellular location of BBR in cells before and after 0.5 µg/ml BBR administration for 1 h. (A–C) HepG2 cells; (D–F) HeLa cells; (G–I) SY5Y cells. The fluorescence of BBR is shown in green, differential interference contrast (DIC) figures represent the scale of cells and scale bar is 10 µm.

