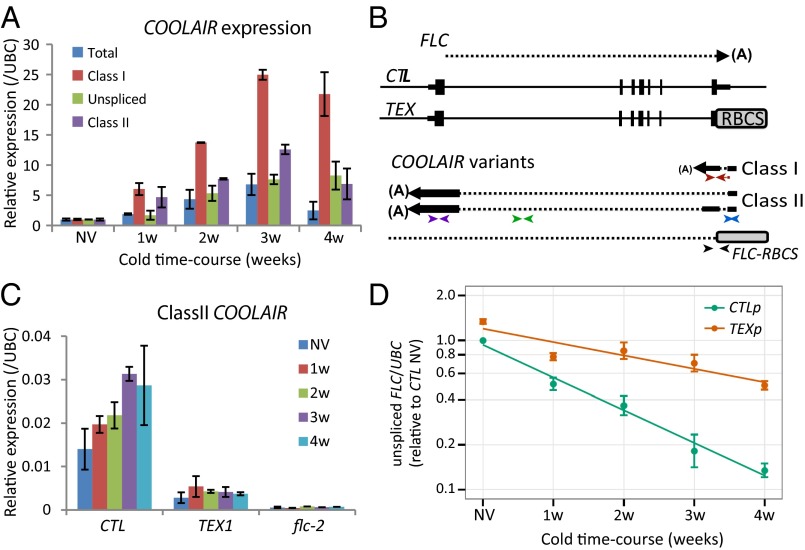
Fig. 1.
COOLAIR accelerates FLC transcriptional down-regulation during vernalization. (A) Quantitative RT-PCR (qRT-PCR) analysis showing COOLAIR forms are differentially induced during a time-course of cold exposure, nonvernalized material (NV), 1 wk cold exposure (1w), 2 wk cold (2w), 3 wk cold (3w), and 4 wk cold (4w). Values are normalized to NV (set as 1), means ± SEM of three biological replicates. (B) Schematic representation of the FLC genomic locus and sense and antisense RNA transcripts in the control (CTL) and Terminator EXchange lines (TEX). CTL lines were generated by transformation of FLC genomic construct (15 kb of the FLC locus, FLC-15) into flc-2 FRI background. TEX lines were generated as described (9, 10). For antisense transcripts in TEX lines, a combination of FLC and RBCS primers were used. (A), pA sites; RBCS, Rubisco gene terminator. The position of the primers used in qRT-PCR analysis to assess class I (red arrows), class II (purple arrows), unspliced antisense (green arrows), total COOLAIR (blue arrows), or antisense RNA transcript derived from TEX construct (black arrows) are shown; sequences are listed in SI Appendix, Table S2. (C) qRT-PCR analysis of class II COOLAIR relative to UBC in CTL and TEX. Values are means ± SEM of three biological replicates. (D) Down-regulation of FLC unspliced RNA is significantly abrogated (P < 0.005) in TEX compared with control during cold exposure. CTLp and TEXp correspond to a mix of 50 T3 transgenic lines (Materials and Methods). Values are means ± SEM of five biological replicates and are plotted on a log scale. NV levels are also significantly different (P < 0.001).

