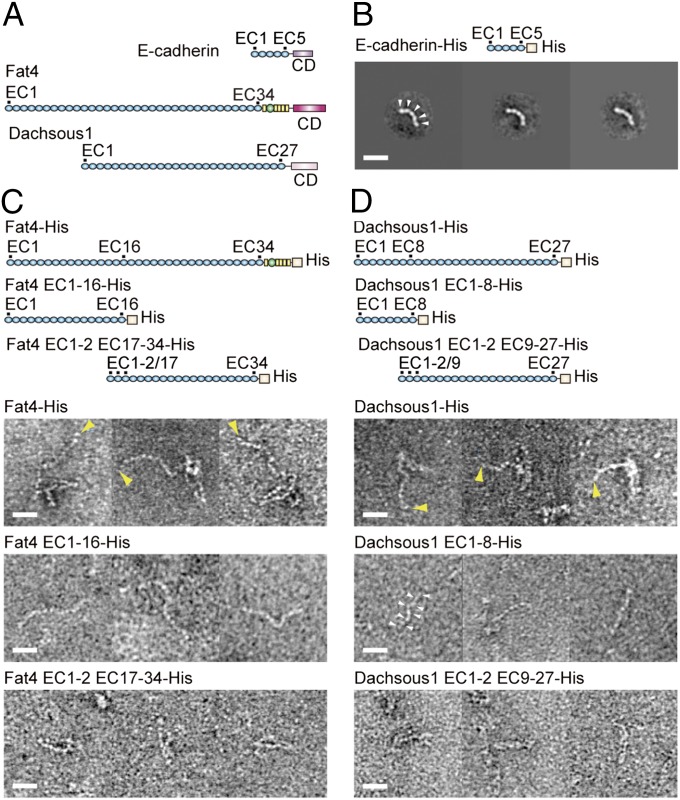
Fig. 1.
Fat4 and Dachsous1 ectodomains in comparison with E-cadherin. (A) Schematic drawings of E-cadherin, Fat4, and Dachsous1. Blue spheres indicate EC domains. Yellow boxes and green spheres represent EGF-like and laminin A-G domains, respectively. CDs indicate cytoplasmic domains. (B) Representative class averages of His-tagged E-cadherin ectodomain. (C and D) Images of His-tagged, full-length Fat4 (Fat4-His) and Dachsous1 (Dachsous1-His) ectodomains, and their truncated mutants. Fat4 EC1-16-His and Dacsous1 EC1-8-His represent a N-terminal fragment of the respective molecule, comprising the EC domains indicated. Fat4 EC1-2 EC17-34-His and Dacsous1 EC1-2 EC9-27-His represent a fusion of EC1 and EC2 with the C-terminal fragment of the respective molecule that comprises EC17 to 34 for Fat4, and EC9 to 27 for Dachsous1. Three representative images are shown for each construct. White arrowheads point to examples of individual EC domains. Yellow arrowheads indicate the putative terminus of the extended portion of the molecule. (Scale bars, 20 nm.)

