Fig. 5.
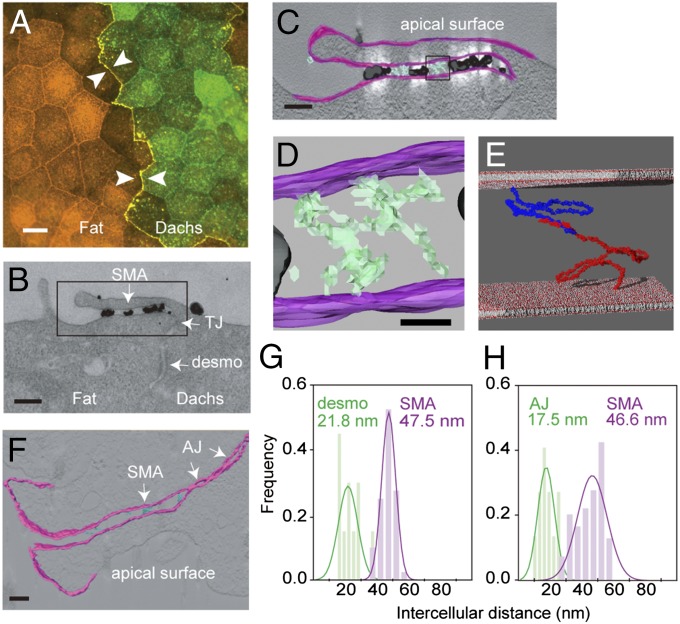
Electron microscopy of cell–cell contacts formed by Fat4 and Dachsous1. (A) Double immunostaining for Fat4 (red) and Dachsous1 (green) in a mixed culture of MDCK cells stably transfected with respective cDNAs. Arrows indicate a boundary between the two transfectants. (B) TEM image of a heterotypic boundary between MDCK cells expressing Dachsous1 (Right) and Fat4 (Left). Black dots represent colloidal gold particles conjugated to anti-Dachsous1 antibodies. The Dachsous1-expressing cell is positioned at the Right, which is identified by the presence of immunogolds on the free cell surface. (Scale bar, 200 nm.) (C) Tomographic visualization of the area boxed in B. Intercellular structures are colored light cyan. (Scale bar, 100 nm.) (D) A close-up view of the area boxed in C. Strand-like structures are detected in the intercellular space. (Scale bar, 20 nm.) (E) Atomic models of Fat4 (in red) and Dachsous1 (in dark blue), chosen from their best-fit models, are arranged to touch one another via their N-terminal four EC domains, and placed in an intercellular space that is 47.5 nm across. (F) Electron-tomographic visualization of the apical cell–cell contacts in neuroepithelial cells of the embryonic cerebral cortex. Strand-like materials visible in the intercellular space are colored cyan. (Scale bar, 100 nm.) (G and H) Quantification of the distances between the cell membranes at the subapical membrane apposition (SAM) formed by Fat4 and Dachsous1 transfectants (G), and those in neuroepithelial cells of the mouse embryonic brain cortex (H). In the latter, the intermembrane distances were measured at the sites where strand-like structures were detectable, and also at neighboring regions. The desmosomes and adherens junctions were also analyzed. AJ, adherens junctions; Dachs, Dachsous1; desmo, desmosome; Fat, Fat4; TJ, tight junction. Cell membranes are colored magenta in tomographic images.

