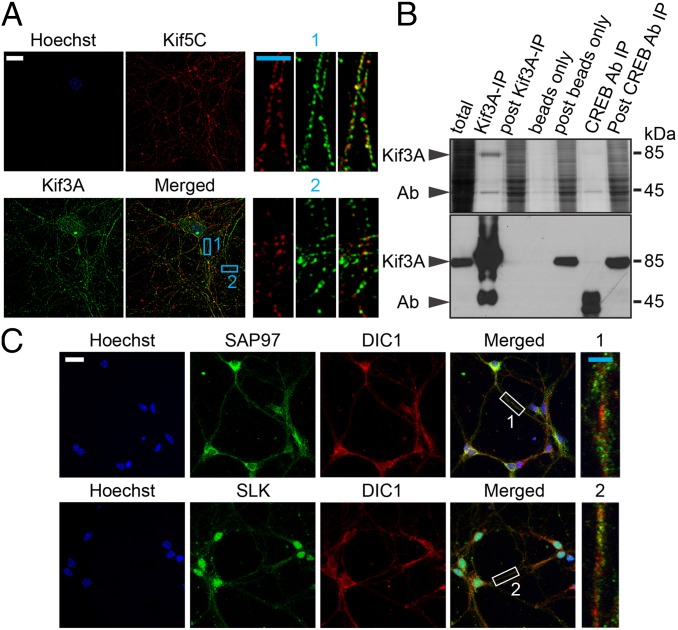
Fig. 3.
Super-resolution imaging of Kif5C and Kif3A distribution in hippocampal neurons and characterization of Kif3A and Kif5C cargos. (A) Representative super-resolution images illustrate the distinct distribution of Kif5C (red) and Kif3A (green) proteins in the same neuron. The nucleus was stained with Hoechst. Digitally enlarged images (corresponding to Kif5C, Kif3A, and merged) show two representative sections from neurites marked 1 and 2 in blue. (B) IP of Kif3A complex from mouse hippocampus. Hippocampi from 7- to 11-wk-old mice were dissected out, and proteins were prepared as described in Fig. 1. (Upper) Kif3A complexes were immunoprecipitated using a specific antibody, and protein complexes were then separated on SDS/PAGE and stained with silver. (Lower) Kif3A also was detected by Western blot analysis. Immunoprecipitation using CREB antibody and beads alone served as controls for IP. Arrows in B indicate the positions of Kif3A and antibody. (C) Immunocytochemical analysis of cargos of Kif3A and Kif5C in cultured primary hippocampal neurons. Shown are confocal projection images of coimmunostaining of SAP97, a Kif3A cargo (green), and DIC1, a Kif5C cargo (red) and of SLK, a Kif3A cargo (green), and DIC1, a Kif5C cargo (red), as well as the merged images. Sections of representative neurites in the merged images are marked 1 and 2 (in white) and are digitally enlarged. (Insets) Expression of cargos in the same neurite. (White scale bar: 20 μm; blue scale bar: 5 μm.)

