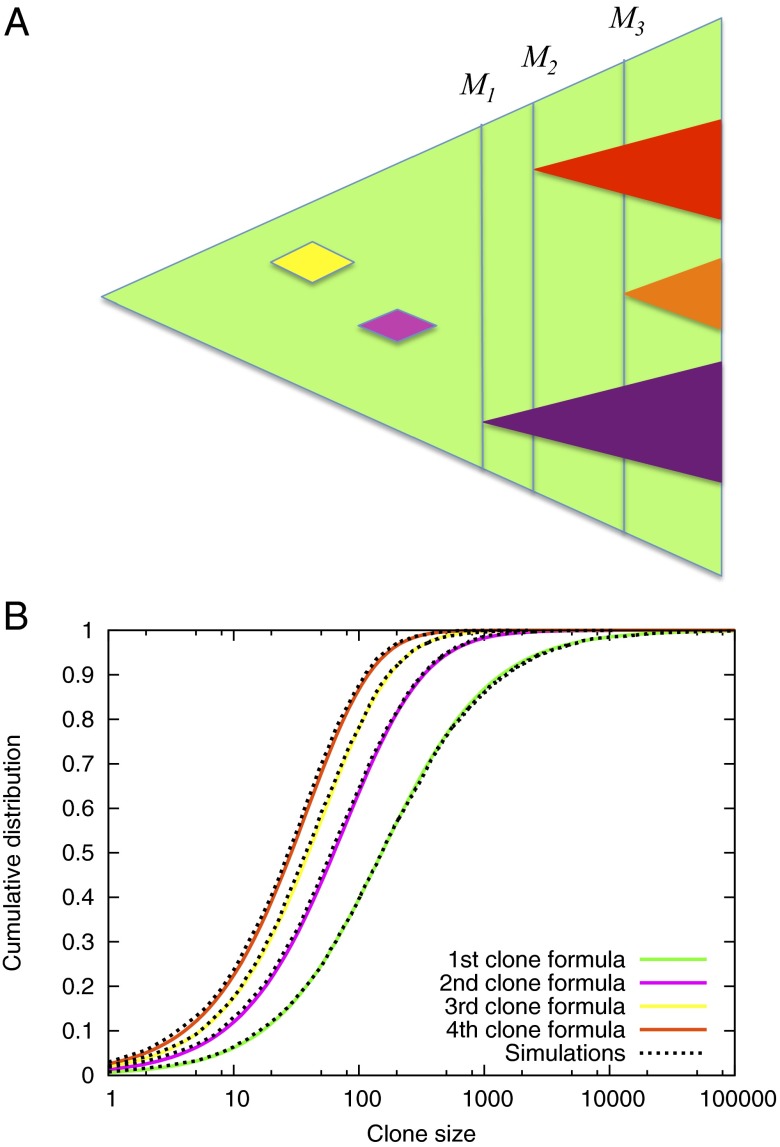
Fig. 1.
Evolution of resistance in a metastatic lesion. (A) As the lesion (green) grows from one cell to detectable size, new resistant subclones appear. Some of them are lost to stochastic drift (yellow and pink), while others survive (purple, red and orange triangle). Instead of looking at the time of appearance of new clones, our approach takes into account the total size of the lesion when the resistance mutation first occurred. (B) Agreement between computer simulations and formula (1) for the cumulative distribution function for the number of cells in the first four resistant clones. The first subclone contains 10 or fewer cells with probability 0.06, between 10 and 100 cells with probability 0.34, between 100 and 1000 cells with probability 0.47 and more than 1000 cells with probability 0.13. The second subclone contains more than 100 cells with probability 0.36. Parameters , , , .

