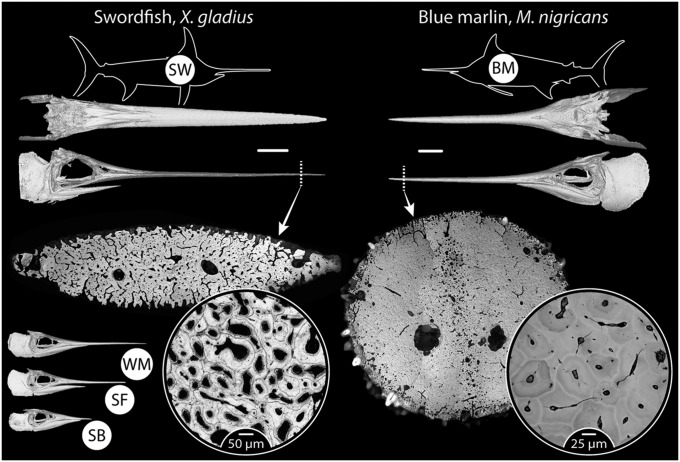
Fig. 2.
Gross morphology and ultrastructure of billfish bone. Swordfish (SW) and blue marlin (BM) are shown here; tissue ultrastructure of the additional species examined (SB, shortbill spearfish; SF, sailfish; WM, white marlin) is shown in Fig. S1. The body plan of the fish is shown as a silhouette, with CT scan images beneath showing the skull in dorsal and lateral perspectives (white bars between CT scans = 10 cm). Light microscopy images of distal, whole bill transverse cross-sections are shown beneath CT scans, demonstrating an array of complex ultrastructures, with circular inset images providing a higher magnification of the acellular osteonal tissue (BM, backscatter electron image; SW, light microscopy image). CT scans of crania of the remaining three species in the lower left corner illustrate the variation in relative bill length among species. Two-letter acronyms for each species (in white circles in species’ silhouettes) are used also in subsequent figures.

