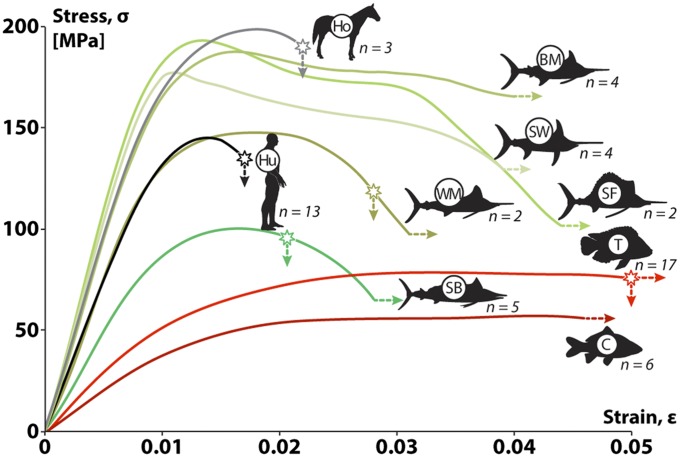
Fig. 5.
Average stress–strain curves for similar-sized bone beams tested in bending, for two mammal species (Ho, horse; Hu, human), five billfish species (see Fig. 2 for acronyms), and two additional bony fishes (C: carp, osteocytic bone; T: tilapia, anosteocytic bone). Young’s modulus is the slope of the initial, linear portion of the stress–strain curve. Stars on curves indicate the average fracture stress/strain for those samples that fractured during testing. Lines that lack stars or continue past the fracture point (i.e., fish species) continued to strain without failure until the displacement limit of the testing machine. Note that, although billfish bone (excepting shortbill, SB) tended to be as stiff as mammal bone (i.e., to have a similar initial slope), it reached considerably larger postyield strains, similar to other fish species (C, carp; T, tilapia). Numbers next to each species indicate number of beams tested.

