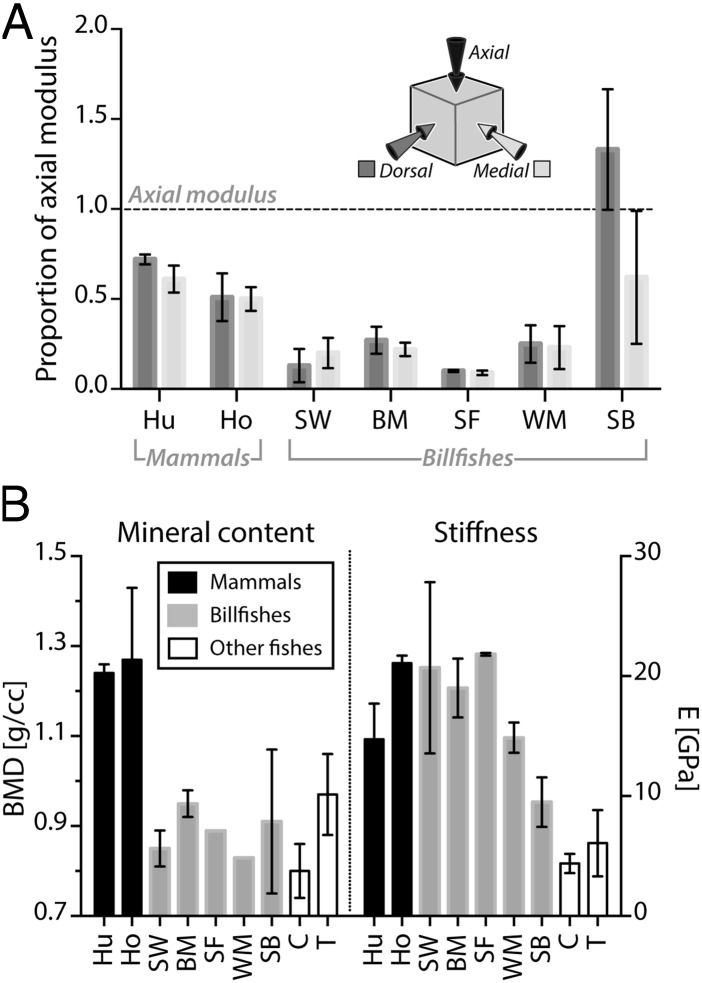
Fig. 6.
Mineral content, stiffness, and anisotropy of bone tissue from mammalian and fish species (see Figs. 2 and 5 for species acronyms). (A) Bone stiffness anisotropy. For each species, the medial and dorsal moduli are plotted relative to the axial modulus (dashed horizontal line at 1.0); values above or below this line indicate orthogonal moduli that are higher or lower than the axial modulus, respectively. Billfish bone, like mammalian bone, is considerably stiffer in the axial direction (i.e., in line with the bill’s long axis), with shortbill again being an exception. (B) Mineral content (BMD) is higher in mammalian species than fish species; however, the stiffness (E) of billfish bone is similar to that of mammalian bone and higher than that of other fish species, with shortbill (SB), exhibiting an intermediate stiffness (see also Fig. 5). Note the different tissue morphology of shortbill relative to other billfish bone in Fig. S1 and see Fig. 4 for tissue ultrastructure associated with the different anatomical orientations. Horse data are from ref. 48 and human data from ref. 49.

