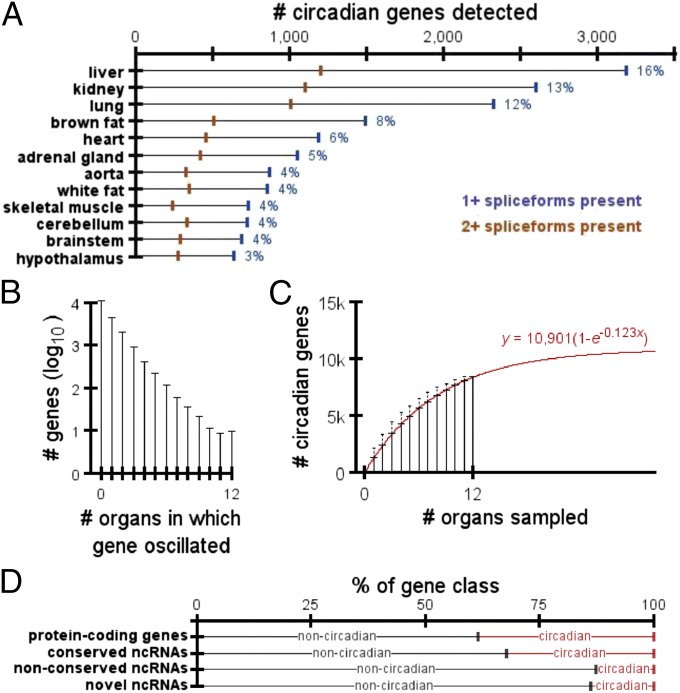
Fig. 1.
Breakdown of circadian genes and ncRNAs. (A) Number of protein-coding genes in each organ with circadian expression. Blue marks indicate the number of genes with at least one spliceform detected by RNA-seq. Orange marks indicate the number of genes with at least two spliceforms detected by RNA-seq. Blue numbers to the right of each bar list the percentage of protein-coding genes with rhythmic expression in each organ. (B) Distribution of the number of organs in which a protein-coding gene oscillated. (C) Average total number of circadian genes detected as a function of the number of organs sampled. Error bars represent SD. Best-fit model has been overlayed in red. (D) Percentages of each transcript class that did vs. did not oscillate in at least one organ.

