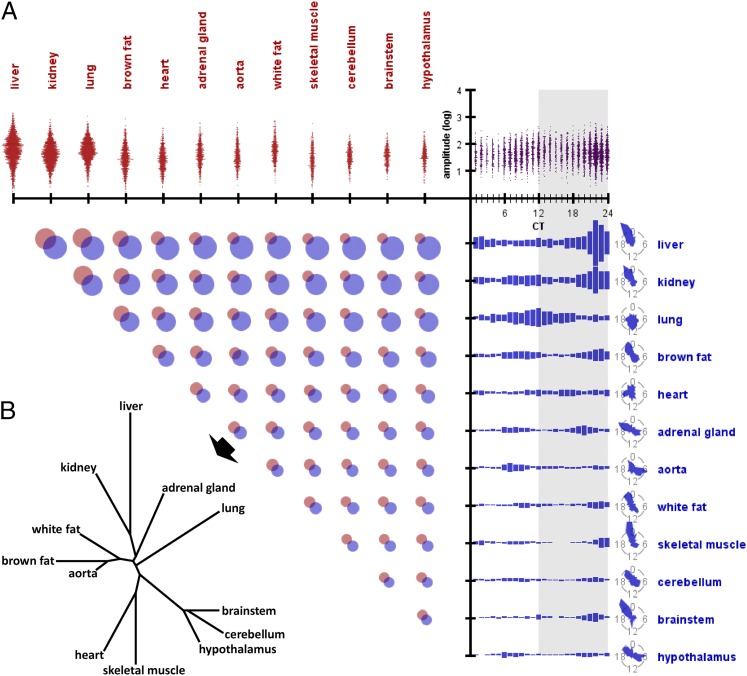
Fig. 2.
Parameters of circadian genes across organs. (A) Relationships among organ, oscillation amplitude, and oscillation phase of circadian genes. (Upper Left) Histograms of amplitudes within each organ (number of circadian genes within each amplitude bin is shown on the horizontal axis, grouped by organ). (Upper Right) Histograms of amplitudes within each phase, across all organs. (Lower Right) Histograms of phases within each organ, with summary radial diagrams (number of circadian genes within each phase bin is shown on the vertical axis, grouped by organ). Larger versions of these radial diagrams are included in Fig. S1C for clarity. (Lower Left) Venn diagrams of the identities of the genes that oscillated within a given pair of organs. (B) Ontogenic tree constructed using the average phase differences between each organ pair’s shared circadian genes as the distance metric. Shared genes correspond to the overlapping regions from Venn diagrams in A.

