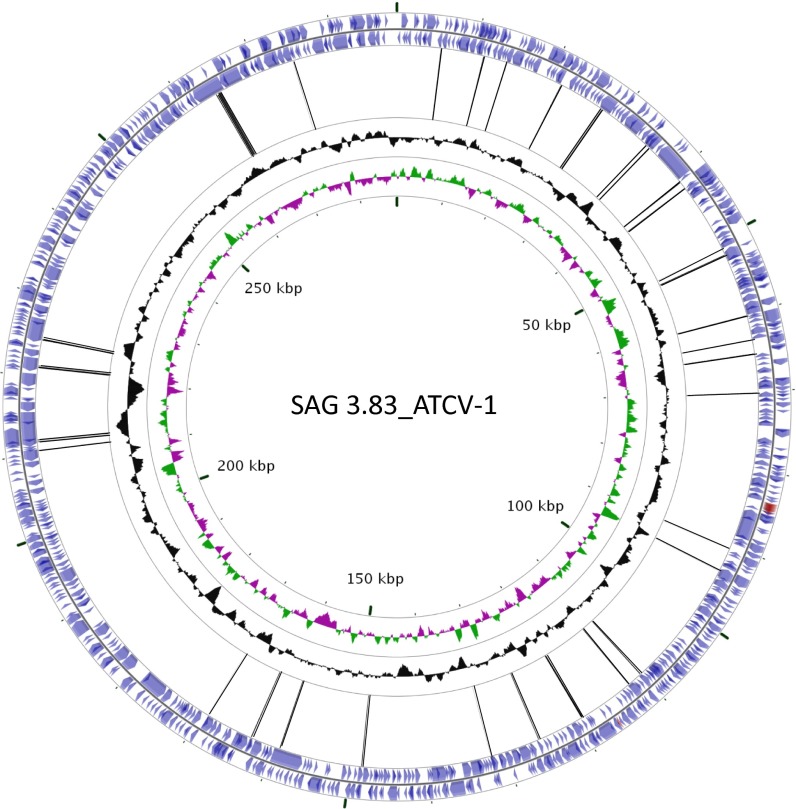
Fig. 1.
Chlorovirus ATCV-1 genome showing the gene block distributions [blue arrows, protein coding sequence (CDS); red arrows, tRNAs] on each strand of the genome. Histograms in black indicate the G+C distribution along the genome; colored histograms (green, magenta) indicate the GC skew of the genome. The most inner circle indicates the genome map position with the start position at “12 o’clock.” The viral genome is a linear dsDNA, but is represented here as a circle for convenience of presentation. Control throat swab deep sequencing consensus sequence reads are matched to ATCV-1, and two experiments (17 and 16 individuals per experiment) are represented by the black lines connecting the gene blocks. BLAST hits, 61; Query, ATCV-1; Subject, human throat swab chlorovirus consensus sequence reads (52).

