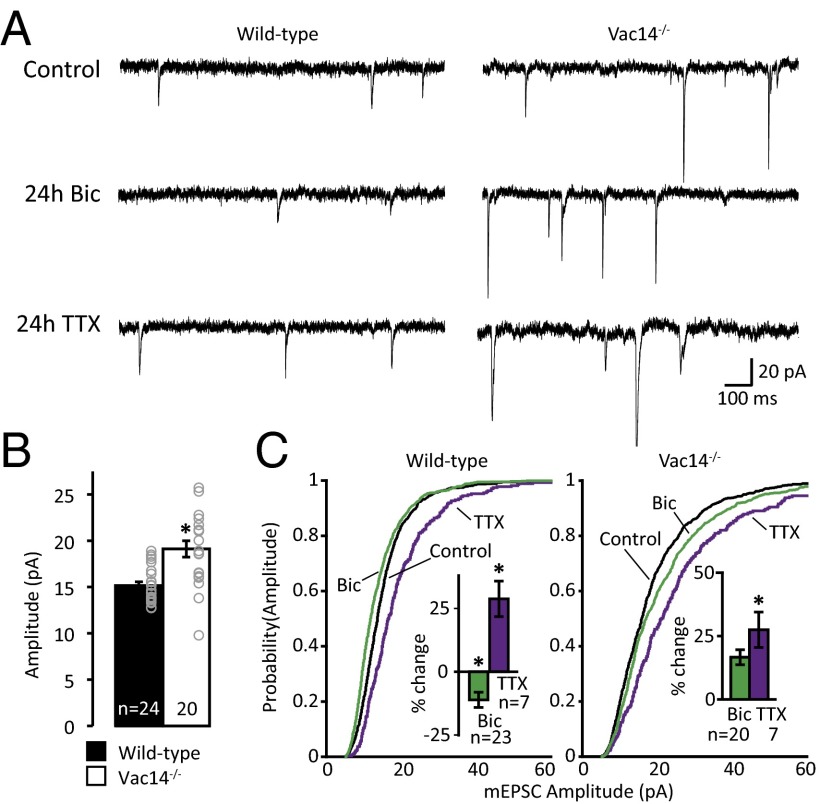
Fig. 4.
PIKfyve activity is required for synaptic depression. (A) Representative example recordings from WT and Vac14−/− mouse hippocampal cultured neurons treated for 24 h with vehicle, 2 μM TTX, or 50 μM bicuculline (Bic). (B) Mean (±SEM) mEPSC amplitude. The amplitude of Vac14−/− mEPSCs is increased relative to WT [WT: 15.16 ± 0.39 pA, Vac14−/−: 19.12 ± 0.88 pA; t(43) = 31.04, P = 4.45 × 10⁻³¹]. (C) Cumulative distribution frequency of mEPSC amplitude from WT (Left) and Vac14−/− (Right) neurons treated for 24 h with vehicle control (black line), 2 μM TTX (purple line), or 50 μM Bic (green line). In WT neurons, the distribution of mEPSC amplitude is left-shifted following 24 h of Bic and right-shifted following 24 h of TTX. Although Vac14−/− neurons normally scale-up mEPSC amplitude in response to 24 h of TTX, they fail to scale-down. All six distributions were compared using the one-way Kruskal–Wallis ANOVA [χ2(5, n = 4,016) = 411.56, P = 9.6 × 10−87] and the results of Tukey–Kramer post hoc test reported here: WT + Bic is different from every group. WT + TTX is different from WT. Vac14−/− + TTX is different from every group. WT control is different from Vac14−/− control. (Insets) Mean (±SEM) percent change in mEPSC amplitude relative to unstimulated controls of the corresponding genotype. In WT neurons, 24 h of treatment with TTX increases mEPSC amplitude and 24 h of treatment with Bic decreases mEPSC amplitude [WT, percent change from control (n = 24): +TTX: 28.79 ± 6.99% (n = 7), +Bic: −11.11 ± 2.97% (n = 23); one-way ANOVA: F(2,51) = 21.41, P = 1.8 × 10⁻⁷]. In Vac14−/− neurons, 24 h of treatment with TTX increases mEPSC amplitude but 24 h of treatment with Bic does not decrease mEPSC amplitude [Vac14−/−, percent change from control (n = 20): +TTX: 24.28 ± 8.99% (n = 7), +Bic: 13.72 ± 6.03% (n = 20); one-way ANOVA: F(2,45) = 4.06, P = 0.02]. *P < 0.05.

