Fig. 3.
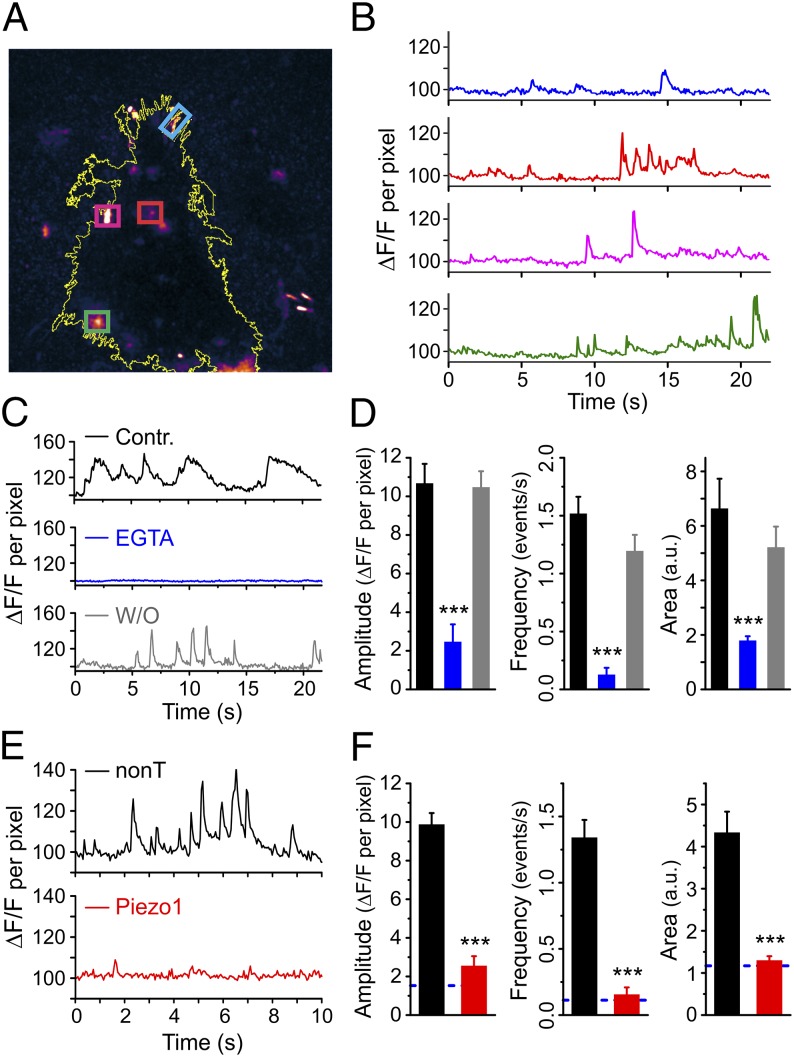
Piezo1 activity elicits spontaneous Ca2+ signals. (A) A maximum projection TIRFM image of an hNSPC cell loaded with Fluo-4 AM from a 600-frame video showing hotspots of Ca2+ activity. Four regions of interest are marked by colored boxes. The yellow line depicts the outline of the cell. See also Movie S1. (B) Plots of fluorescence intensity over time in the hotspots highlighted in A. The color of the trace matches the corresponding box color in A. Data are shown as signal per pixel with the fluorescence intensity at the start of the recording normalized to 100 (SI Methods). (C and D) Spontaneous Ca2+ transients are reversibly inhibited by addition of 6 mM EGTA to the bath solution. n = 22 for control (Contr.), 28 for EGTA, and 27 for washout (W/O). (E and F) hNSPCs transfected with Piezo1 siRNA show fewer and smaller spontaneous Ca2+ transients than cells transfected with nontargeting siRNA. The blue dashed line in F represents the levels expected in the absence of external calcium (based on D). n = 44 for nontargeting siRNA, and n = 53 for Piezo1 siRNA. Error bars represent SEM. ***P < 0.001 by two-sample t test. a.u., arbitrary units. See also Fig. S3.

