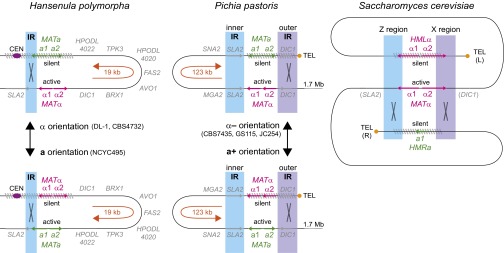
Fig. 2.

MAT locus organization and mating-type switching in H. polymorpha, P. pastoris, and S. cerevisiae. Blue and purple shading show the IRs. Orange arrows show the orientation of the invertible regions. Two other arrangements of the P. pastoris region (alpha+ and a−), resulting from exchanges in the inner IR that do not change the mating type, are not shown (Fig. 5). In the S. cerevisiae diagram SLA2 and DIC1 indicate the genes that flanked the MAT locus in the ancestor of family Saccharomycetaceae, although they no longer are at this position in S. cerevisiae because of chromosome erosion (29).
