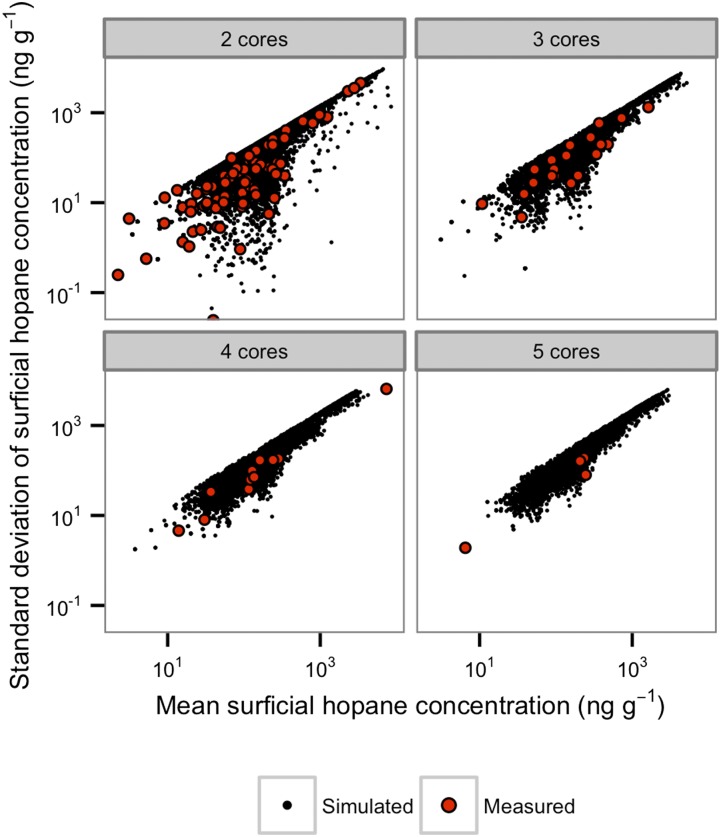
Fig. 3.
Comparison of measured variation in surficial hopane concentrations within sampling sites (red dots) and modeled variation within simulated sampling sites (black dots). Within-site variability was assessed in the particle deposition model by simulating deposition on a patch of sediment, randomly sampling two, three, four, or five nonoverlapping loci with the same cross-sectional area as standard push-cores, calculating the hopane signal that would result from the combination of background signal and oil particles captured within each locus, and comparing the results across loci within the same simulated site.

