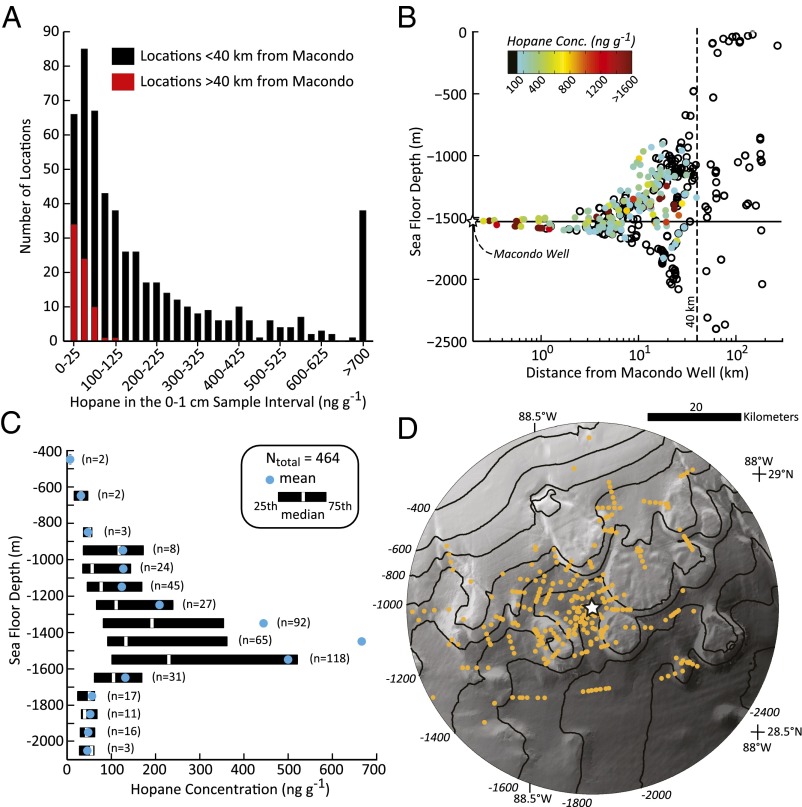
Fig. 4.
Spatial distribution and concentrations of hopane in surficial sediments. (A) Histogram of all surficial hopane samples (n = 534) binned by concentration. (B) Plot of data from A with respect to sea floor depth and distance from the Macondo Well and colored by hopane concentration. Twenty-one samples have concentrations >1,600 ng⋅g−1 with a maximum concentration of 12,800 ng⋅g−1. (C) Box plot showing the depth distribution of surficial hopane concentration for all locations within a 40-km radius of the Macondo Well. The median (white bars), mean (blue dots), and 25th and 75th percentile confidence limits (black box) are shown for samples binned by 100-m sea floor depth intervals. (D) Map view of all sample locations within 40 km of the Macondo Well (orange dots and white star, respectively) as plotted in C, with 200-m bathymetry contour intervals shown (black lines).

