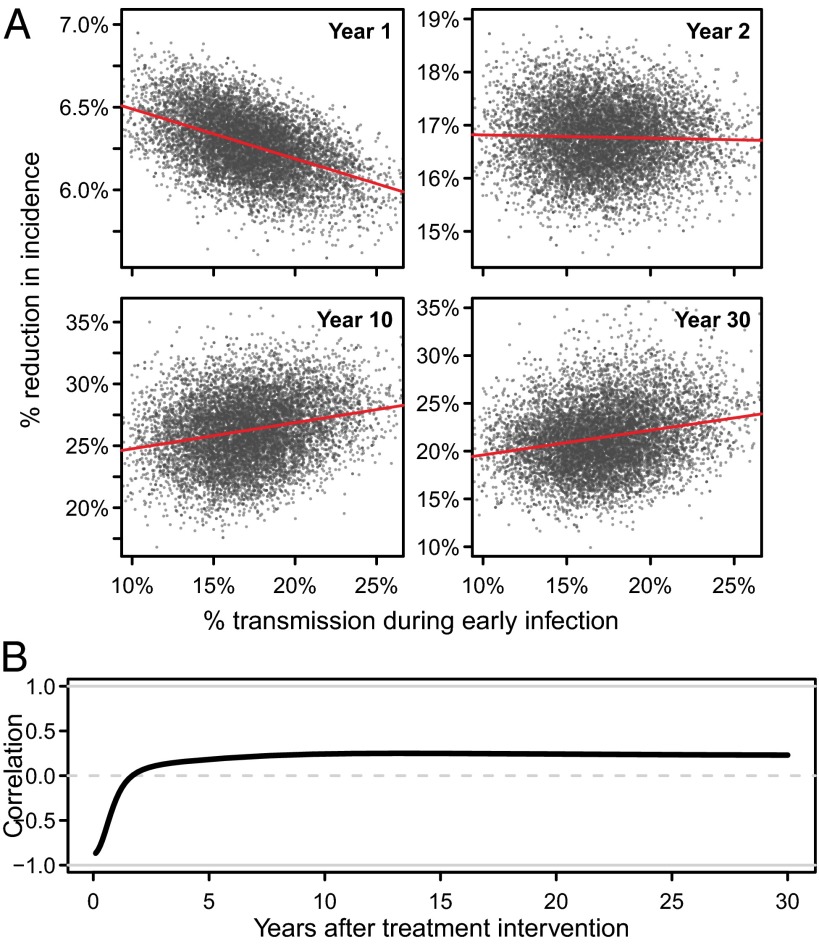
Fig. 3.
Correlation between percentage of early transmission in 2010 (when ART is introduced) and the reduction in HIV incidence rate over time relative to projected incidence in the absence of ART. (A) Scatter plots comparing the percentage of early transmission in 2010 and the percentage reduction in incidence rate in the first, second, 10th, and 30th years (note: vertical axes are not the same). (B) The Pearson correlation coefficient between early transmission at intervention start and the percentage reduction in incidence rate over time.

