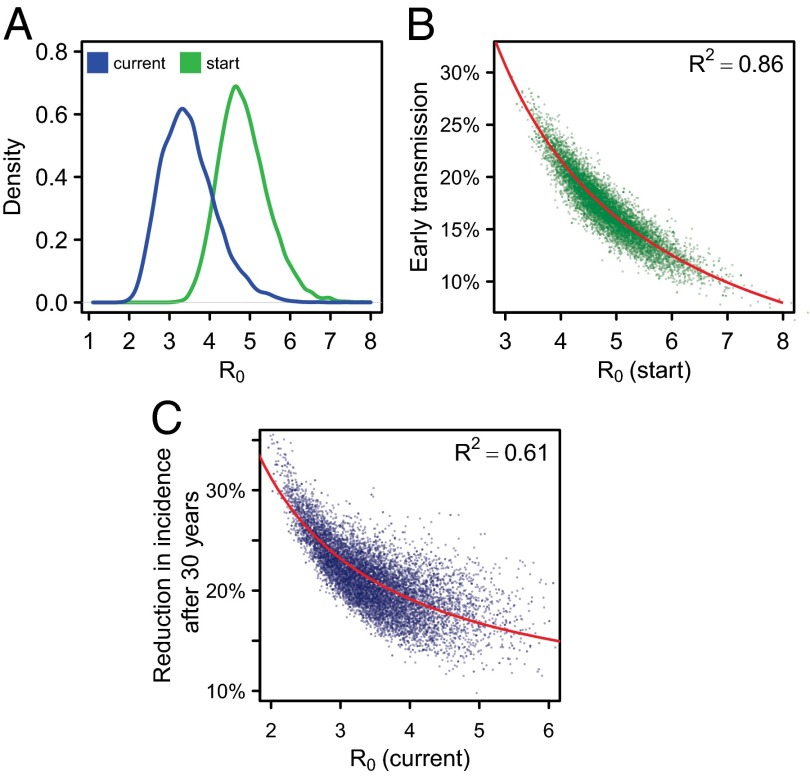
Fig. 4.
R0, early transmission, and reduction in incidence. (A) The distribution of R0 at the start of the epidemic (green) and during the intervention period (blue), after behavior change. (B) The relationship between R0 at the start of the epidemic and the percentage of early transmission in 2010, at the start of the intervention. (C) The relationship between R0 during the intervention period and the reduction in HIV incidence rate after 30 y. Red lines indicate the fitted linear relationship between 1/R0 and early transmission (B) or reduction in incidence rate (C).

