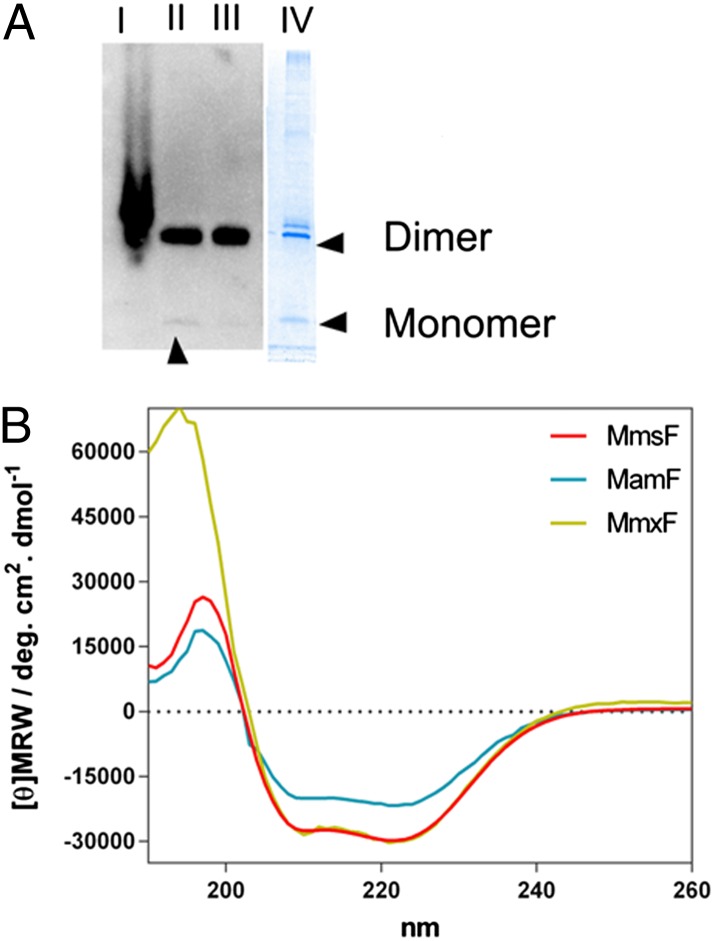
Fig. 2.
(A) Western blot image of MmsF production. Lane I is the total cell lysate, lane II is the soluble lysate after centrifugation, and lane III is the unbound protein after passage through Strep-Tactin Sepharose resin. A Coomassie-stained protein gel image of purified MmsF is shown alongside in lane IV. The assumed dimer and monomer bands are indicated. The faint monomer band on the blot is highlighted by an arrowhead. (B) CD spectra of the three proteins. MmsF is shown in red, MamF is shown in blue, and MmxF is shown in gold. [θ]MRW, mean residue molar ellipticity.

