
Fig. 2.
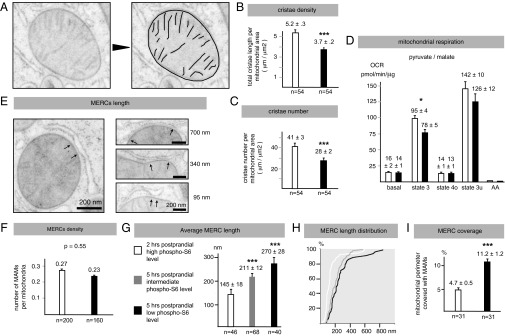
Postprandial loss of mTORC1 signaling is accompanied by decreased cristae density and respiration and augmented MERC length. (A) Representative image and analysis of liver mitochondria used to study cristae number and density. (B and C) Effect of the change in phospho-S6 level on mitochondria cristae number and density. (D) Oxygen consumption rate (OCR) of liver mitochondria energized with 10 mM pyruvate + 2 mM malate. Data represent mean ± SEM of five independent experiments. (E) Representative image of the MERCs analyzed in this study. Arrows indicate the two extremities of the MERC, which are defined as the structures where the cytosolic side of the OMM interfaces the ribosome-free ER membrane with a gap of 9–15 nm between these two membranes (21). (F–I) Effect of the change in phospho-S6 level on MERC number, size density, and mitochondria coverage. Data represent mean ± SEM. *P < 0.05; ***P < 0.001.