
Fig. 6.
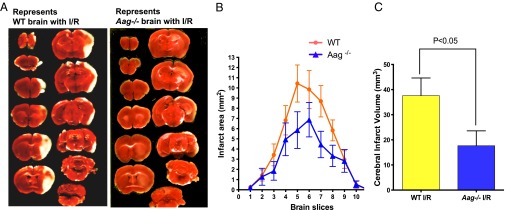
MCAO model of stroke demonstrates protective phenotypes against I/R in Aag−/− mice. (A) Representative triphenyltetrazolium chloride-stained brain slices 24 h after reperfusion. The white areas indicate regions of infarction. (B) Infarct areas evaluated by ImageJ analysis (n = 10 for WT; n = 11 for Aag−/−). (C) Indirect infarct volume is calculated as the volume of the contralateral hemisphere minus the noninfarcted volume of the ipsilateral hemisphere; vertical bars represent ± SEM (n = 10 for WT; n = 11 for Aag−/−).