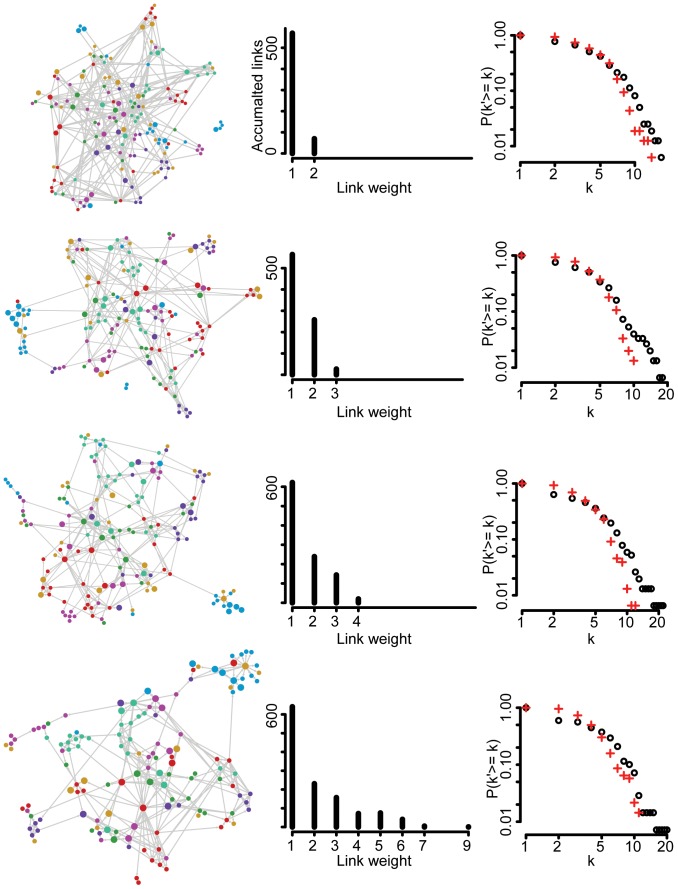
Figure 2. Four networks from different weeks indicate how student interactions develop.
The density  for each network. Colors represent different sections of students. Females are represented by large circles, males by smaller circles. For each week right panel shows the degree distributions (in and out). The middle panels show the accumulated link weight distribution, indicating the extent to which links are reused. The total numbers of nodes in the networks are 161, 152, 154, and 139 respectively.

