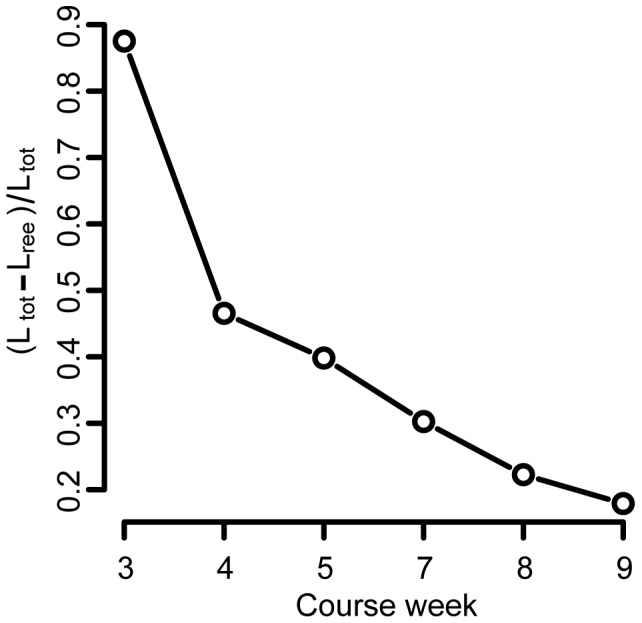
Figure 4. The fraction of completely new links relative to the total number of links,  , decreases over time.

This is not due to students saturating connections, since summed over all weeks; students use a total of 5% of all available links.
