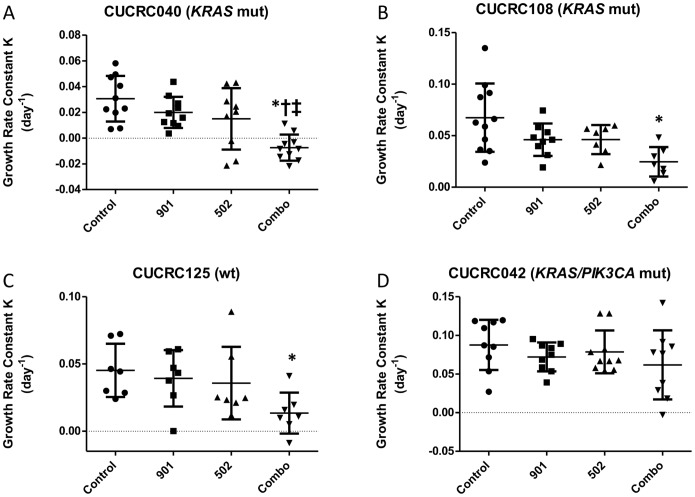
Figure 7. Tumor growth rate analysis on patient-derived tumor xenograft models (PDTX). Tumor growth rates were determined for each individual tumor by fitting tumor volume data over the course of the treatment period to an exponential growth rate equation.
Each point represents a single tumor. Mean tumor growth rate ± standard deviation are represented by the bar and handles. All data presented as mean±SD, ANOVA Tukey’s adjusted p values: *P<0.05 vs. Control; †P<0.05 vs. 901; ‡P<0.05 vs. 502.

