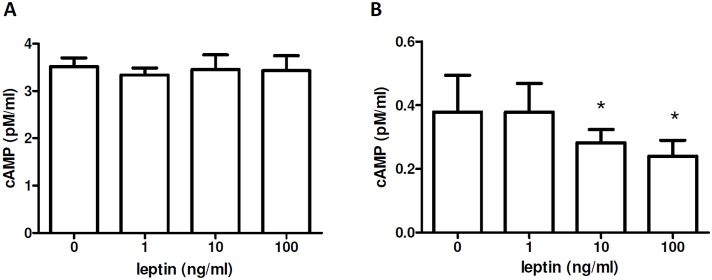
Figure 4. Effects of leptin on cAMP levels in macrophages.

cAMP was measured as intracellular (A) and in supernatant (B) of NZB/W macrophages cultured 1 h with scalar doses of leptin (see Methods for further details). Representative of three experiments in triplicate. *p<0.05 vs control (0)
