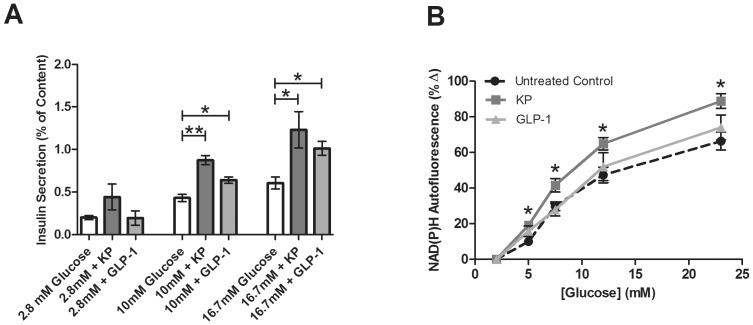
Figure 1.
A. Percent of insulin content secreted from intact islets after static incubation at 2.8, 10, or 16.7 mM glucose with and without KP (1 µM, dark gray) or GLP-1 (20 nM, light gray). Secretion from untreated control islets is shown in white. Data are the mean ± S.E. n = 4–19. *(p<0.05) and **(p<0.001) indicate significance compared to untreated control. B, Glucose-dependent percent change in NAD(P)H from untreated intact islets (circles) and islets treated with KP (1 µM, squares) or GLP-1 (20 nM, triangles) compared to values at 2 mM glucose. Data are the mean ± S.E. n = 9–11. *p<0.01.

