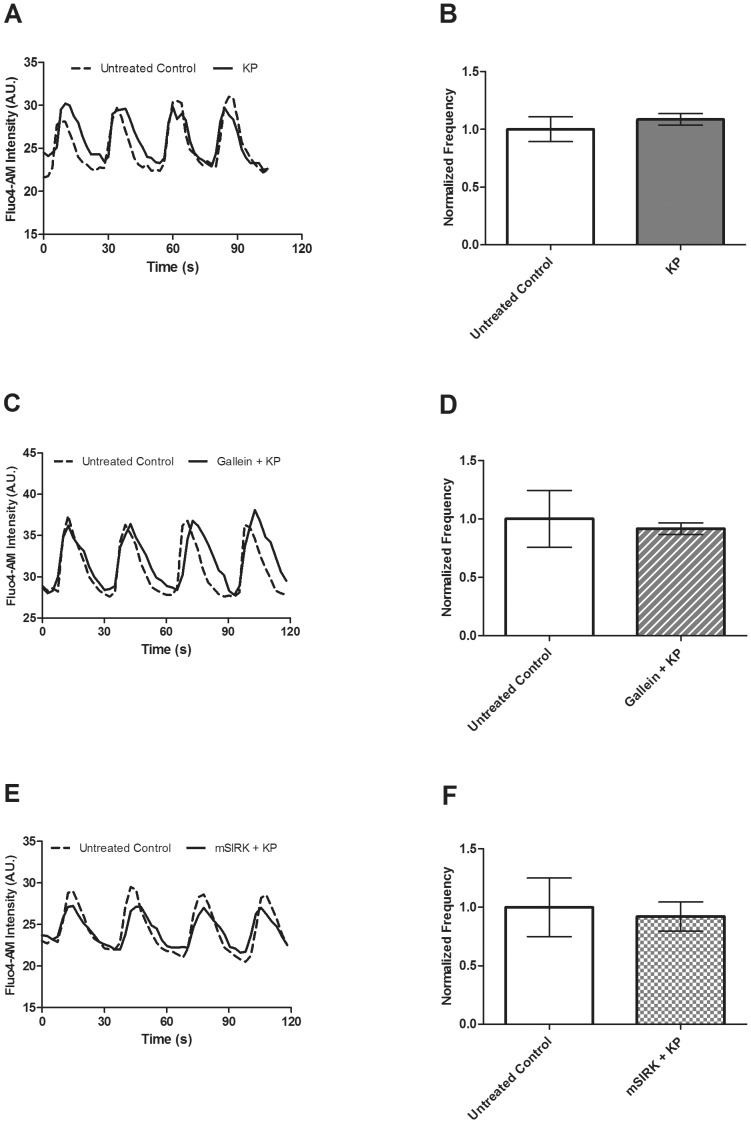
Figure 2.
A. Changes in Fluo4 signal recorded at 10 mM glucose in the presence and absence of KP (1 µM) alone or in combination with gallein (10 µM) or mSIRK (30 µM) to measure the frequency and amplitude of [Ca2+]i oscillations. A, C, & E, Representative oscillations in [Ca2+]i recorded from intact islets before (dotted line) and after (solid line) treatment with KP (A), gallein+KP (C), or mSIRK+KP (E). B, D & F, The normalized frequency of [Ca2+]i oscillations pre- and post-treatment with KP (B), gallein+KP (D), or mSIRK+KP (F). Data following addition of KP (dark gray), gallein+KP (dark gray stripes), or mSIRK+KP (dark gray checks) are normalized to the data collected from the islet prior to treatment. Data are the mean ± S.E. n = 4–5. p>0.4.

