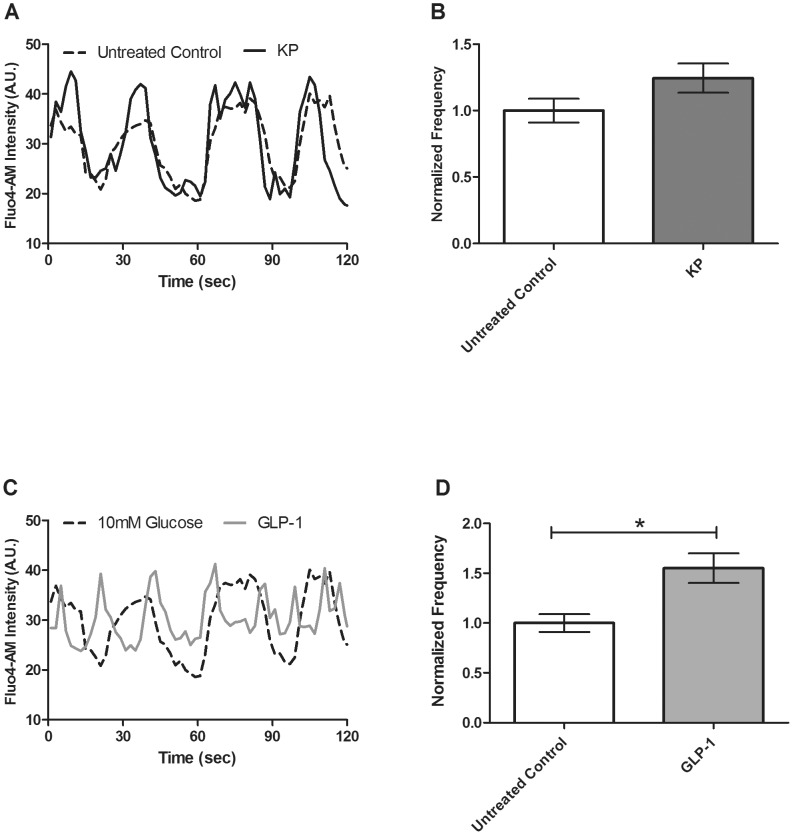
Figure 3. Changes in Fluo4 signal in dispersed β-cells recorded at 10 mM glucose in the presence and absence of KP (1 µM) or with GLP-1 (20 nM) to measure the frequency and amplitude of [Ca2+]i oscillations.
A & C, Representative oscillations in [Ca2+]i recorded from dispersed β-cells before (dotted line) and after (solid line) treatment with KP (A) or GLP-1 (C). B & D, The normalized [Ca2+]i oscillation frequency measured pre- and post-treatment with KP (B, dark gray) or GLP-1 (D, light gray). Data are normalized to the data collected from the dispersed β-cells prior to ligand treatment (white). Data are the mean ± S.E. n = 4. p<0.05.

