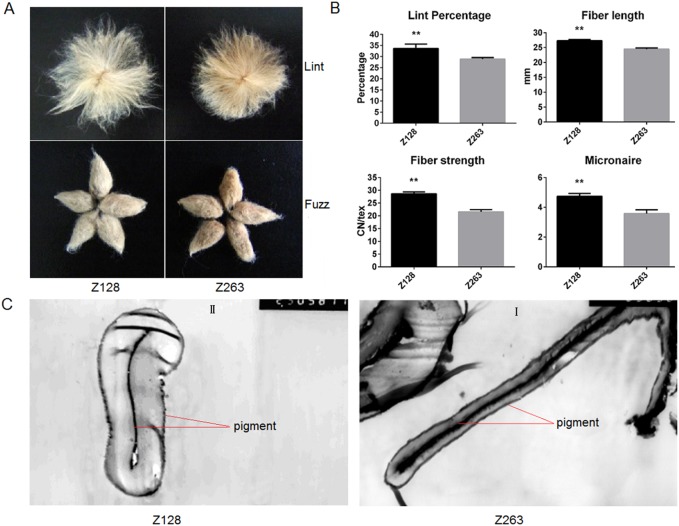
Figure 1. The fiber color, yield, quality and microstructure of Z128 and Z263.
Statistical analyses were performed at 95% condence with IBM SPSS Statistics 11.0 (SPSS Inc., Chicago, USA). Values with an asterisk represented a significant differe- nce at P<0.05. The fiber microstructure of Z263 (C I) and Z128 (C II) was observed under a microscope (×3000 and ×2500, respectively).

