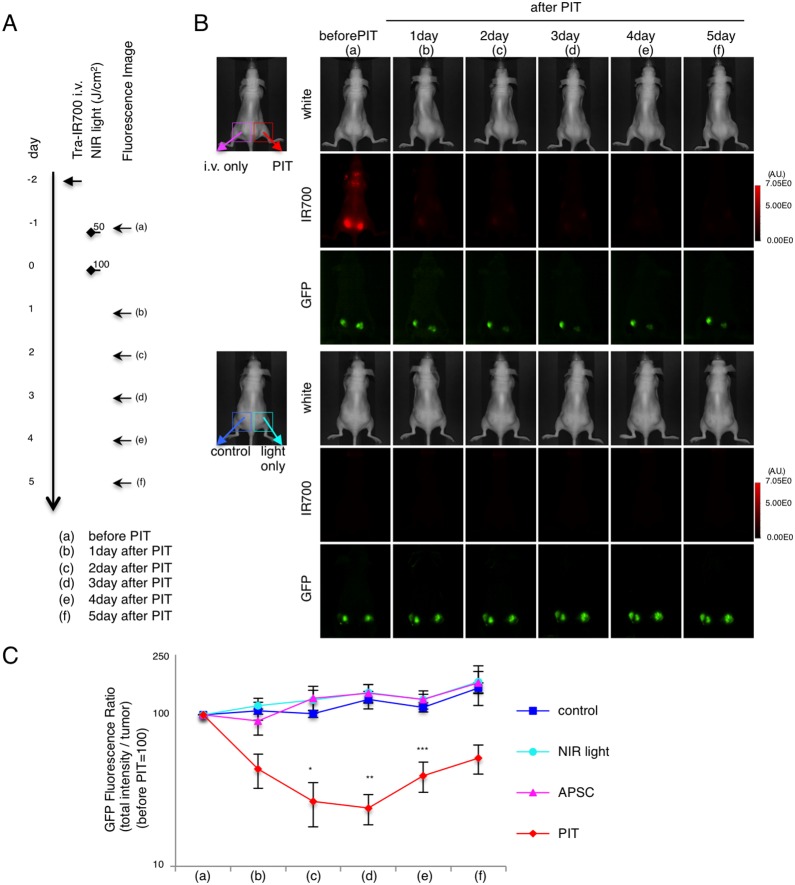
Figure 3. GFP fluorescence imaging of PIT in vivo in bilateral N87-GFP flank model.
(A) PIT regimen. Fluorescence images were obtained at each time point as indicated. (B) In vivo GFP fluorescence real-time imaging of bilateral flank tumor bearing mice in response to PIT. The tumor treated by PIT showed decreasing GFP fluorescence after PIT. (C) Quantitative analysis of GFP fluorescence intensities (total intensity/tumor) in N87-GFP tumor bearing mice showed significantly decreased fluorescence between the control group and the PIT group (n = 5 mice in each group, (*p = 0.0118<0.05, vs. control) (*p = 0.0016<0.01, vs. NIR light) (*p = 0.0012<0.01, vs. APSC) (**p = 0.0010<0.01, vs. control) (**p = 0.0003<0.001, vs. NIR light) (**p = 0.0003<0.001, vs. APSC) (***p = 0.0049<0.01, vs. control) (***p = 0.0039<0.01, vs. NIR-light) (***p = 0.0012<0.01, vs. APSC), Tukey’s test with ANOVA).

