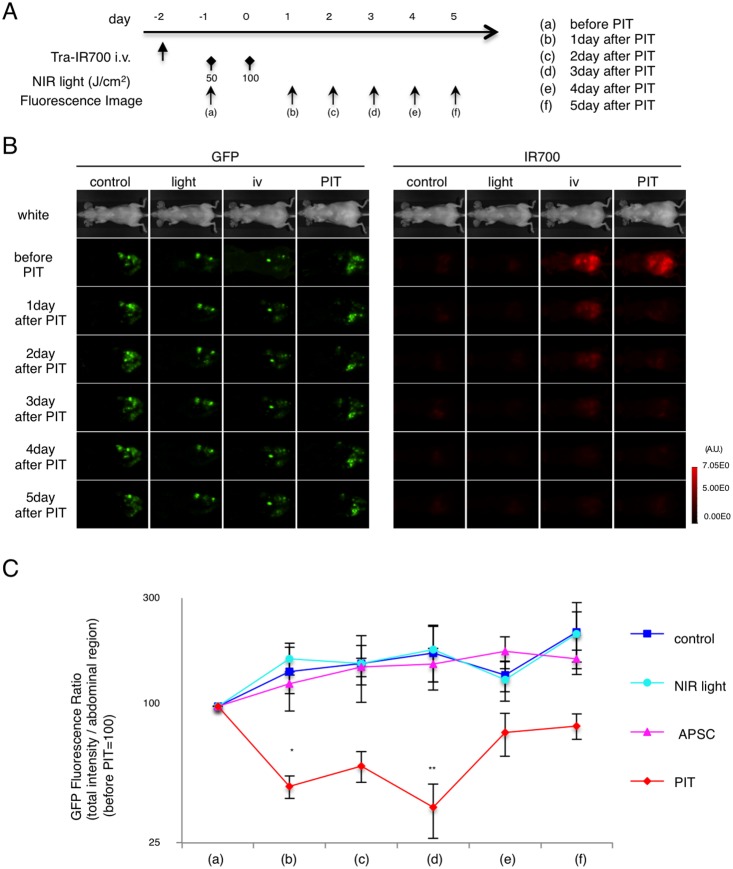
Figure 6. Evaluation of PIT effects in a disseminated peritoneal model.
(A) PIT regimen. Real-time GFP fluorescence imaging was obtained at each time point indicated. (B) In vivo real-time fluorescence imaging in response to PIT. (C) Quantitative analysis of GFP fluorescence intensities showed significant decreases by day 3 after PIT between control group and PIT group (n = 5 mice in each group, (*p = 0.0295<0.05 vs. NIR light) (**p = 0.0489<0.05 vs. control) (**p = 0.0355<0.05 vs. APSC), Kruskal-Wallis test with post-test).

