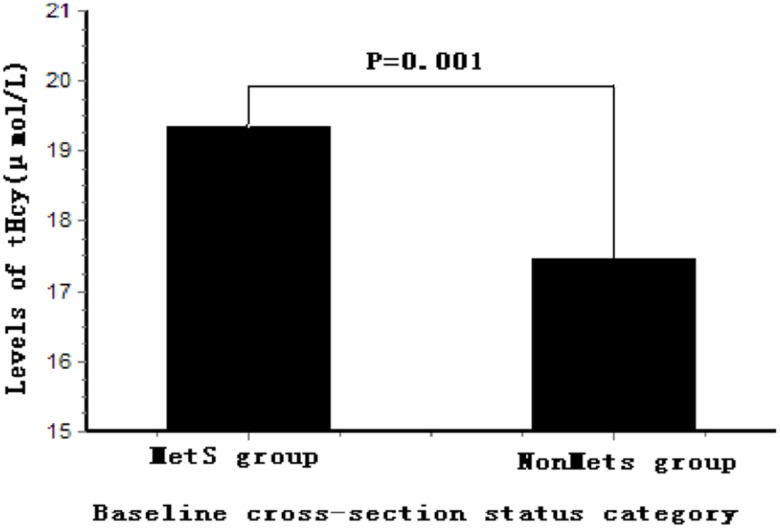
Figure 1. Comparison of serum tHcy levels between MetS group and NonMetS group at baseline MetS status.
The levels of tHcy in the MetS group were higher than that in NonMetS group (P = 0.001) at baseline cross-sectional status. Levels of tHcy were Ln transformed to normalize their distributions. tHcy, total homocysteine; MetS, metabolic syndrome.

