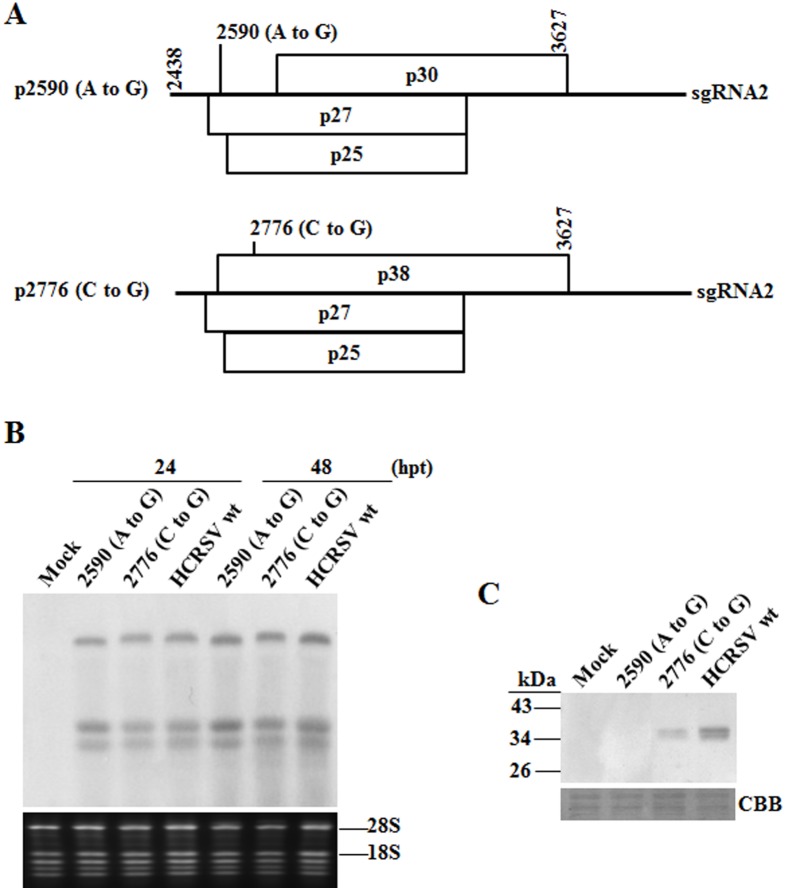
Figure 2. HCRSV RNA and CP accumulation in transfected kenaf protoplasts.
(A) Schematic representation of mutant 2590 (A to G) and mutant 2776 (C to G). Only region covering sgRNA2 is shown to indicate the mutation sites. p30 is an ORF encoding a putative 30 kDa protein. (B) Northern blot analysis of viral RNA accumulation. In vitro transcripts (10 µg each) were transfected into 9×10⁵ protoplasts and harvested at different time points. Total RNA (2.5 µg each) extracted from protoplasts collected at 24 and 48 h post transfection (hpt), respectively, was used for viral RNA detection. DIG-labeled 425 bp HCRSV PCR product located in the 3′ region of the genome was used as the probe for hybridization. (C) Western blot analysis of HCRSV CP. Total protein was extracted from protoplasts collected at 72 hpt. CBB denotes Coomassie blue staining.

