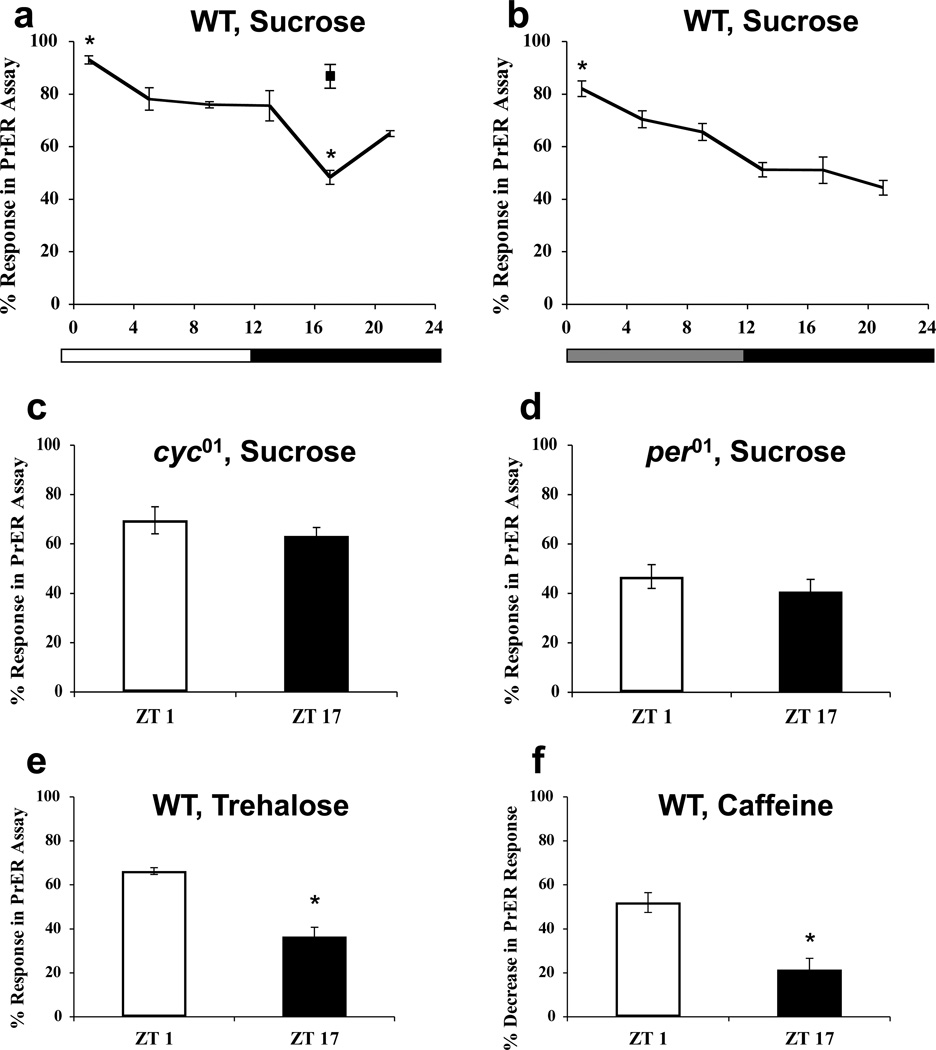
Figure 3.
Drosophila display circadian rhythms in gustatory behavioral responses. (a, b) PrER responses to 100 mM sucrose (black line) or 500mM sucrose (filled square) were measured in WT flies during LD cycles (a) or the first day of constant darkness (b). The overall effects of time of day in LD (a) and constant darkness (b) are significant (p < 0.001) by one-way ANOVA. Asterisks indicate significant (p < 0.05) changes in PrER behavior at ZT1 and ZT17 (a) or CT1 (b) compared to all other times of day. (c, d) PrER responses to 100 mM sucrose were measured in cyc01(c), and per01(d) flies at ZT1 and ZT17. The difference in mean PrER responses at ZT1 and ZT17 are not significant (p > 0.30) in cyc01 or per01 flies. (e) PrER responses to 100 mM trehalose were measured in WT flies at ZT1 and ZT17. Asterisks indicate a significant (p < 0.001) reduction in PrER responses at ZT17 compared to ZT1. (f) Decrease in PrER responses to a 100 mM sucrose solution containing 10 mM caffeine versus 100mM sucrose alone in WT flies at ZT1 and ZT17. Asterisk indicates significant (p = 0.025) decrease in PrER inhibition by caffeine at ZT17 compared to ZT1. All values are mean +/− S.E.M.

