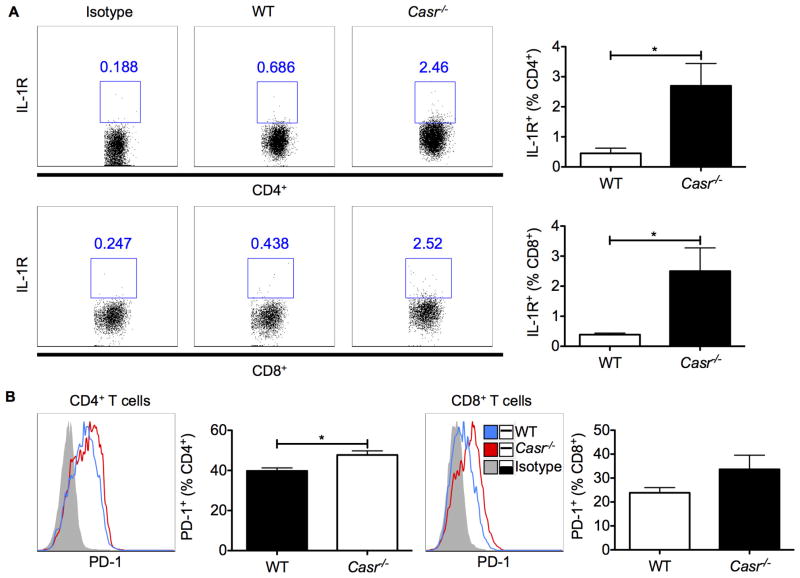
Figure 5. (1.5 columns). Colonic T cell phenotype in Casr−/− mice.
Cell surface expression of IL1R (A) and PD-1 (B) on CD4+ and CD8+ T cells was analyzed by flow cytometry. Data represent observations from two independent experiments and are shown as mean +/− SEM. *P<0.05 compared to WT. n=5 mice/group.

