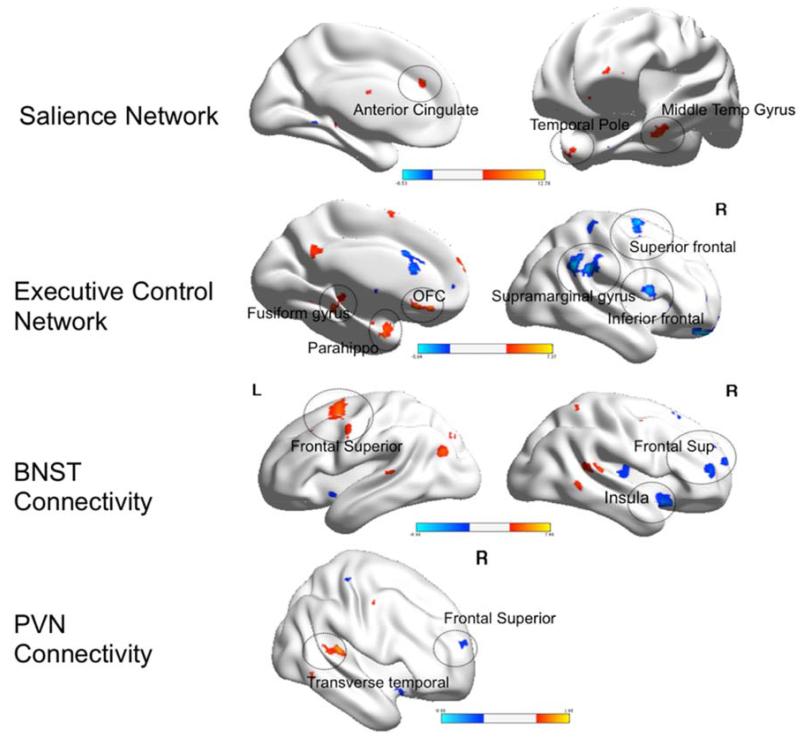
Figure 5.
Within group differences in functional connectivity during worry reappraisal between pre- and post-treatment elderly GAD participants
Legend. Red: pre>post-treatment. Blue: post>pre-treatment. BNST= bed nucleus of stria terminalis. PVN= paraventricular nucleus. L=left, R=Right. OFC=orbito-frontal cortex. Parahippo=parahippocampal cortex; PFC=prefrontal cortex. Visualized using BrainNet Viewer, version 1.42(64). Salience Network: Anterior cingulate (t=12.7; df=11); Temporal pole (t=7.4; df=11); Middle Temporal Gyrus (t=9.1; df=11). Executive Control Network: Fusiform gyrus (t=11.6; df=11); Parahippocampus (t=8.4; df=11); OFC (t=9.1; df=11); Superior frontal (t=7.2; df=11); Supramarginal gyrus (t=13.2, df=11); Inferior frontal (t=6.9; df=11). BNST Connectivity: Frontal superior (L) (t=7.4, df=11); Insula (t=8.9; df=11); Frontal superior (R) (t=5.4; df=11). PVN Connectivity: Transverse temporal (t=6.5; df=11); frontal superior (5.7; df=11).

