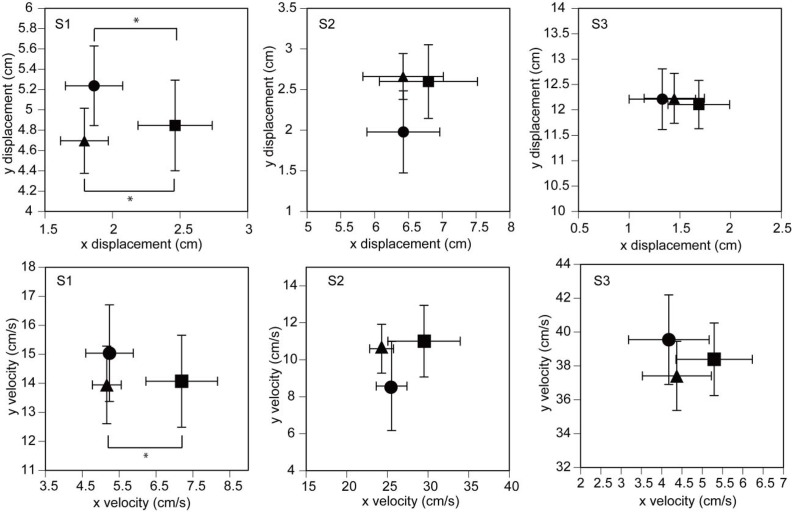
Figure 3.
The amplitude (upper figures) and velocity (lower figures) of COP displacement for the asymmetry analysis. The data points indicate the means, and the error bars indicate the standard error of the mean. The triangle points indicate the means in the L condition, the circle points indicate the means in the NI condition, and the square points indicate the means in the R condition. Asterisks indicate significant differences (p < 0.05)

