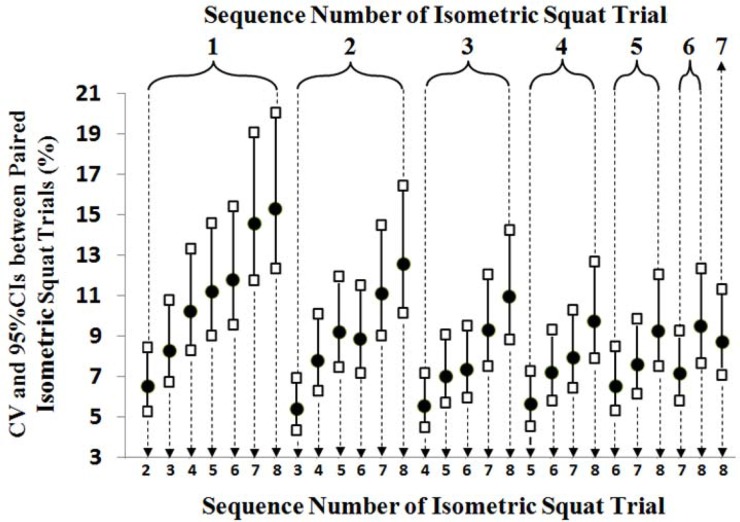
Figure 1.
Coefficients of variation (CV) and 95% confidence intervals (CIs) among the log-transformed data of 8 relative maximal isometric squat strength measurements obtained in the study
Circles and squares represent CVs and 95% CIs, respectively.
The numbers above the brackets at the top of the graphic indicate the sequence number of the isometric squat trial paired with other trials (represented by dotted arrows) for the statistical analyses

