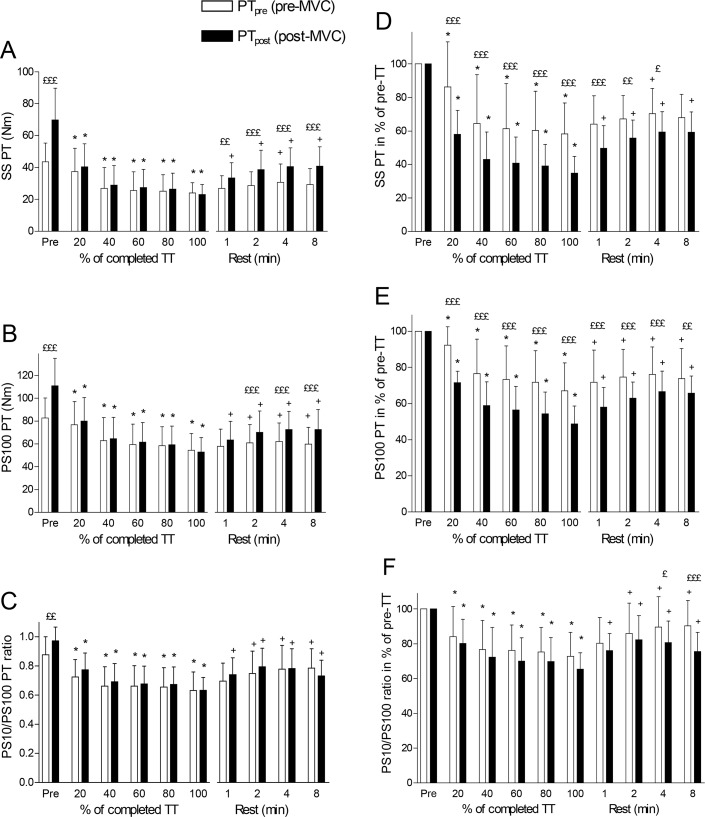
Figure 2.
Absolute and relative peak evoked torque (PT) response to electrical stimulation for pre-MVC (PTpre) and post-MVC (PTpost) single stimulus (SS) (A and D), paired stimuli at 100 Hz (PS100) (B and E), and PT ratio for paired stimuli at 10 Hz (PS10)/PS100 (C and F) before, during and for 8 min after a knee extension-flexion TT in a dynamometer. Values are expressed as means ± SD, n = 10. Significant differences between PTpre and PTpost: ££ p <0.01; £££ p <0.001; significant difference from pre-values for the same variable during the TT: * p <0.05; significant difference from 100% (end of TT) for the same variable during rest: + p <0.05.

