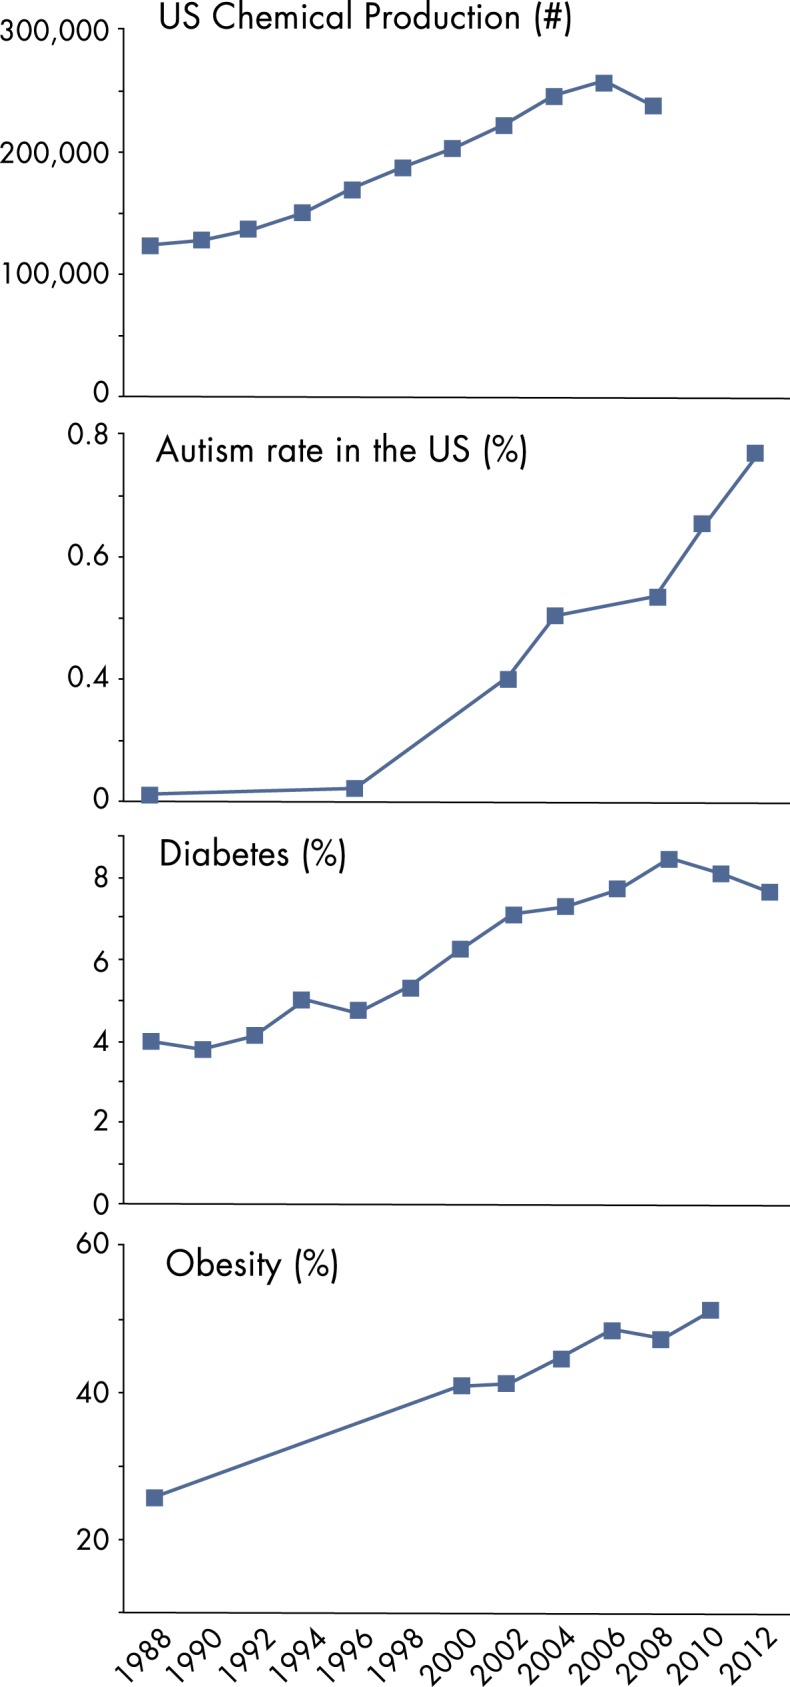
Figure 3.

Chemical production and increased disease prevalence since the mid-1980s are shown here. Data were modified from Refs. 273 and 274; http://www.cdc.gov/nchs/hus/contents2012.htm#063; http://www.cdc.gov/diabetes/statistics/incidence/Figure2.htm; and Autism Speaks!/CDC. Data on chemical production were collated by Rachel Delaney (U.S. EPA AWBERC Library) and Robert Sargis, MD, PhD, University of Chicago. To generate data for the chemical production graphic, Dr Sargis used a combination of U.S. Tariff Association data and C&E News production data. [Modified from B. A. Neel and R. M. Sargis: The paradox of progress: environmental disruption of metabolism and the diabetes epidemic. Diabetes 60:1838, 2011 (273); and C. A. Boyle et al: Trends in the prevalence of developmental disabilities in US children, 1997–2008. Pediatrics 127:1034, 2011 (274)].
