
Figure 3.
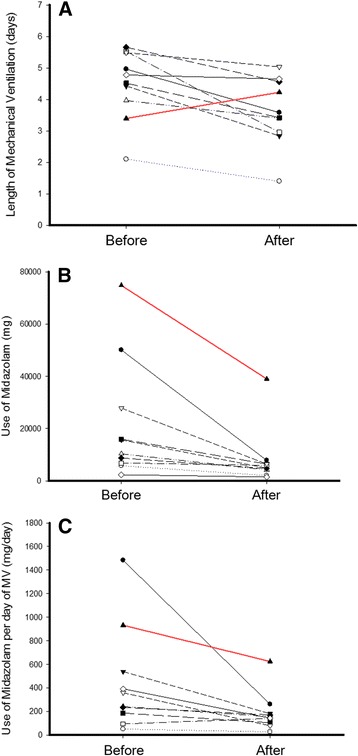
Comparisons of length of mechanical ventilation and midazolam consumption among units in each of the ten units in the quality improvement project. (A) Length of mechanical ventilation. (B) Midazolam consumption. (C) Midazolam consumption per day of mechanical ventilation (MV). The red line denotes the only unit which showed an inclination toward increased length of mechanical ventilation in the period (mean difference, 0.83 (95% CI, −1.10; 2.76), P = 0.38).