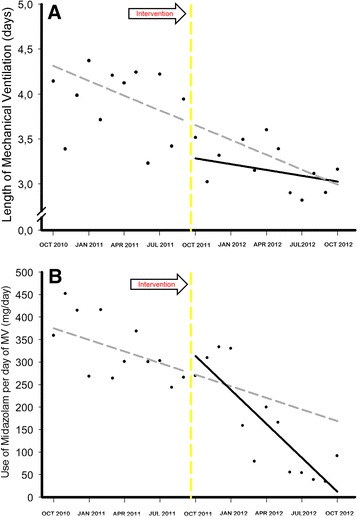
Figure 4.

Interrupted time series from the autoregressive integrated moving average model. Length of mechanical ventilation (MV) (A) and adjusted midazolam consumption (B) over time. Solid black circles represent the average data per month. Solid black line represents the fitted line for the observed data after the protocol implementation. Gray dashed line represents the forecasted values from the model if the protocol was not implemented during the period. Yellow dashed line represents when the intervention began.
